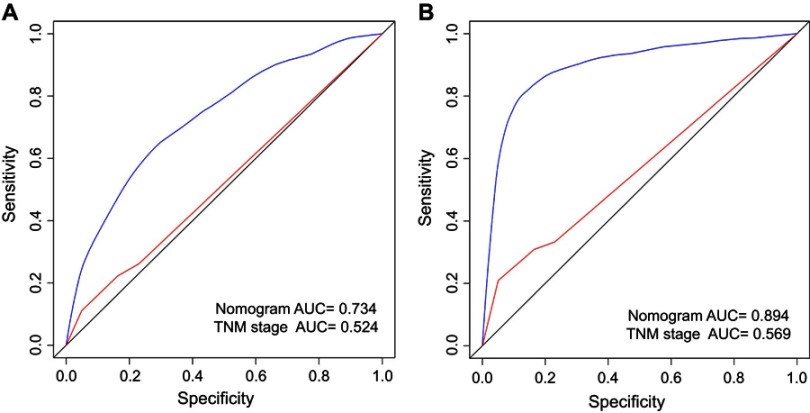
Figure 4.
Comparison of the AUCs of the nomogram and TNM staging system in training set.
Notes: Area under the curves of the two models to predict 10-years OS (A) and CSS (B) in the training set. The blue lines represent nomogram-predicted overall survival rates, whereas the red lines represent TNM stage-predicted overall survival rates.
Abbreviations: AUC, area under ROC curve; CSS, cancer-specific survival; OS, overall survival; ROC, receiver operating characteristic.

