Figure 4.

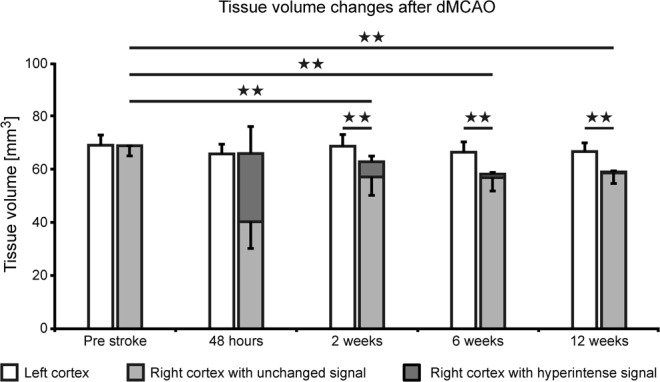
Cortical volume changes after dMCAO. Quantitative analysis of the cortical tissue volume with hyperintensity (dark grey bar) and of the normal appearing tissue (light grey bar) is presented for the whole 12 weeks observation after dMCAO. While the hyperintensity is maximal at 48 hours with 38 ± 15% of cortical volume, it quickly decreases and reaches values of 0.6 ± 0.5% at week 12. Already visible at week 2 is the loss of cortical tissue, as the sum of light and dark grey bars are significantly less than the cortical volume of the contralateral hemisphere. This tissue loss further increases with time. Error bars represent standard deviation. All individual volume data of all stroke animals at all time points are compiled in the Supplement Table 1. Error bars are presented as SD.
