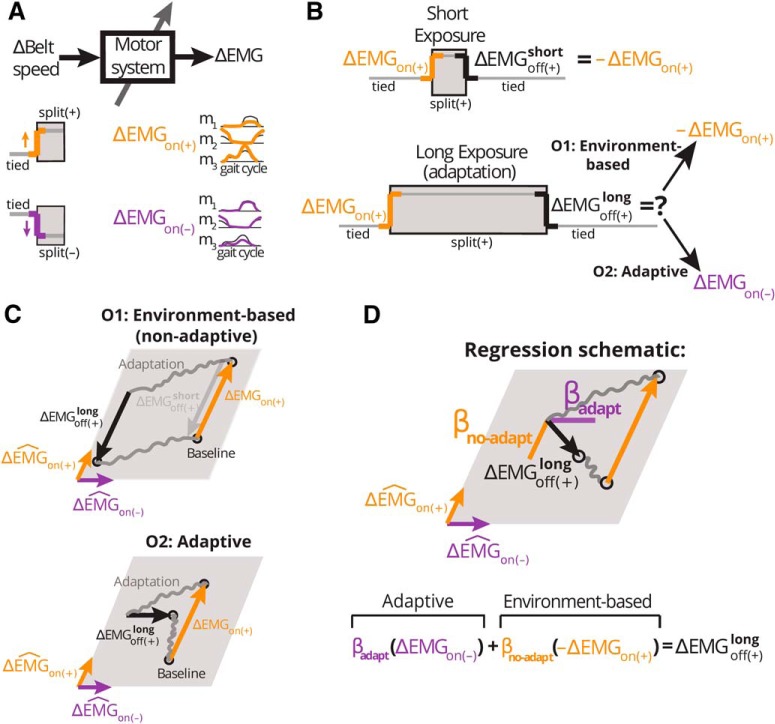
Figure 2.
Schematic of the expected corrective responses following short and long exposures to split-belts walking. A, schematic of the input-output relation (system) of study. We consider belt-speeds (the walking environment) as the input to the system and motor commands (as measured by EMG activity) as its output. We specifically proved rapid EMG changes in response to sudden transitions in the walking environment. Hypothetical EMG patterns in response to an on (+) and on (–) transition are illustrated in yellow and purple, respectively. In the on (+) transition, the dominant leg walks unexpectedly faster than the non-dominant one and vice versa for the on (–) transition. B, we contrasted corrective responses on removal of the (+) environment following either a short () or a long () exposure duration. In the case of a short exposure (top), we expect muscle activity to return to the activation pattern before the introduction of the split-belts environment. In the case of a long exposure (bottom), corrective responses could either remain the same as those following a short exposure (i.e., non-adaptive, O1); or be adaptive, exhibiting a structure similar to that in the “off (–)” transition (O2). C, schematics of hypothetical patterns of activity in muscle space under the environment-based (O1) and adaptive (O2) alternative outcomes. We present a two-dimensional muscle space for illustration purposes, but we characterized muscle patterns in a 360-dimensional muscle space. A point in this space represents a pattern of activity across all muscles, whereas colored arrows represent changes in muscle activity from one activation pattern to another on an environmental transition. EMG changes over the course of adaptation and washout periods (gray) were not investigated. Under O1, (black) and (yellow) are expected to be numerically opposite. Under O2, is expected to be equal to (purple). D, schematic and equation of the regression model used to quantify the structure of . βadapt quantifies the similarity to responses expected under O2, whereas βno-adapt to those under O1.

