Figure 7.
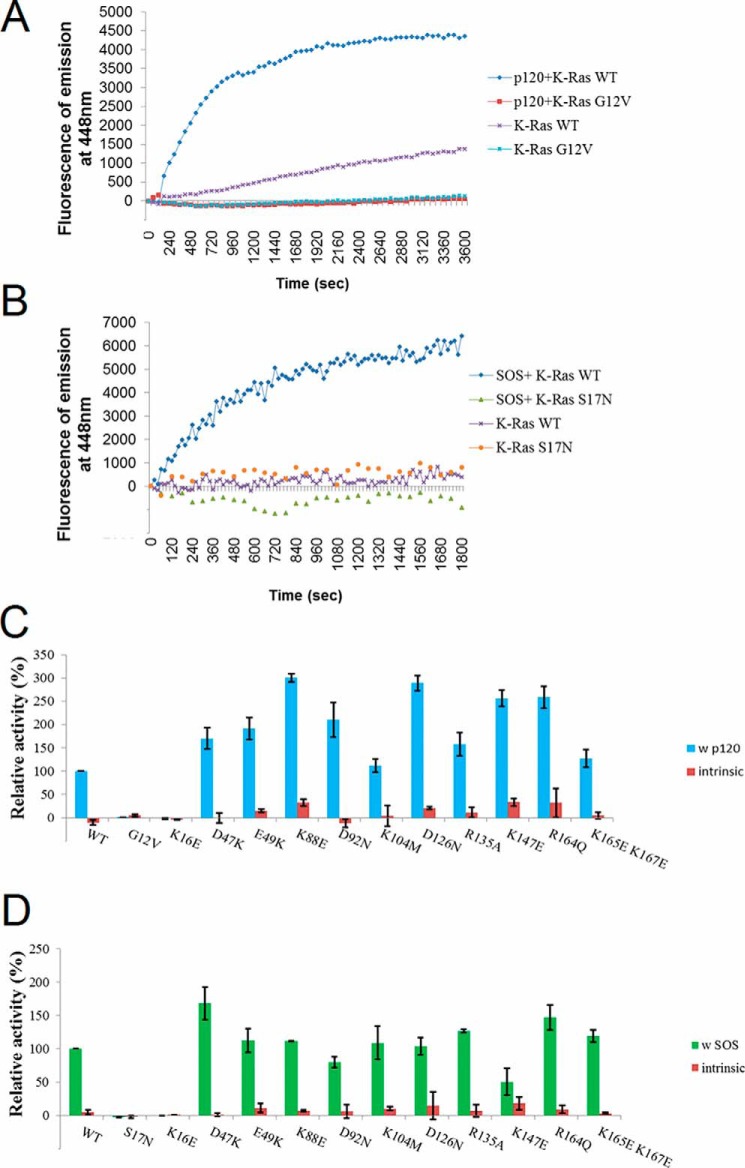
GAP and GEF activity of designed K-Ras4B mutants. Assays were carried out for the intrinsic and p120Ras GAP-aided GTP hydrolysis activity and for the intrinsic and SOS GEF-stimulated nucleotide exchange activity. A, representative time courses of intrinsic and p120 GAP-stimulated GTP hydrolysis activities are shown for K-Ras WT and G12V. B, representative time courses of intrinsic and SOS GEF-stimulated exchange activities are shown for K-Ras WT and S17N. C, histograms of relative intrinsic and p120 GAP-stimulated hydrolysis activities of K-Ras constructs, with intrinsic hydrolysis activities shown in red, and stimulated hydrolysis rates shown in blue (WT K-Ras was scaled to 100%). D, histograms of relative intrinsic and SOS GEF-stimulated exchange activities of K-Ras constructs, with intrinsic exchange activities shown in red, and stimulated exchange rates shown in green (WT scaled to 100%). Note: the intrinsic rates in C and D and their uncertainties are plotted as multiplied by a factor of 3 to increase visibility.

