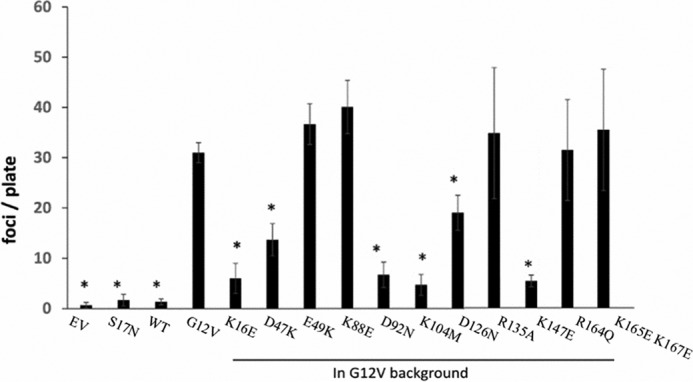
Figure 8.

Transformation activity of designed K-Ras4B mutants as measured in foci formation of NIH3T3 cells. y axis of the histograms is the foci count per plate (asterisk indicates the transformation activity of mutants that are statistically significantly from G12V based on apaired t test, i.e. p < 0.05). EV indicates untransformed cells. K-Ras4B.G12V and K-Ras4B.S17N were included as positive control and negative control, respectively. The foci formation activity of the designed K-Ras4B mutants were all based on the oncogenic G12V background.
