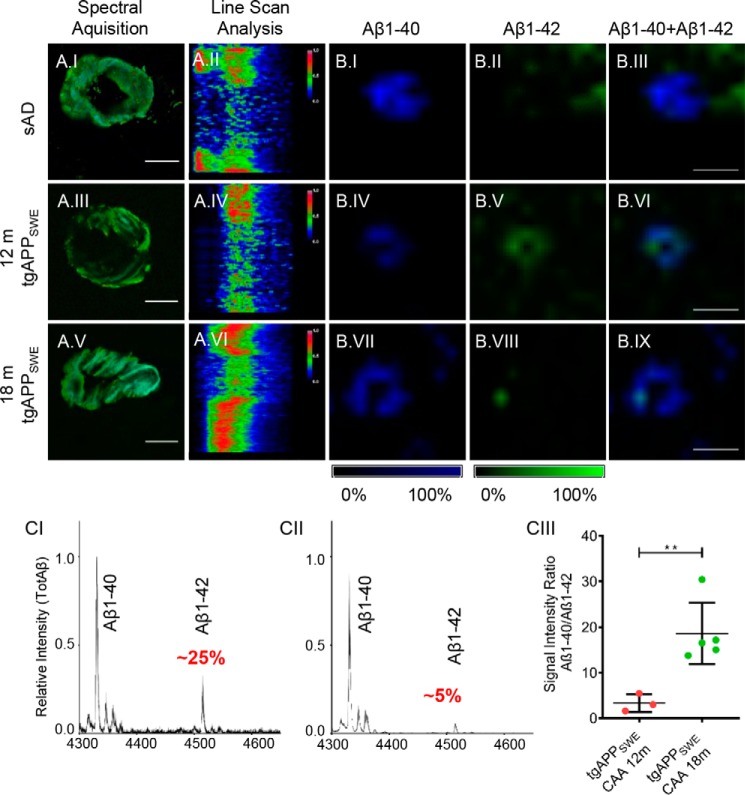
Figure 5.
Parenchymal CAA in s-AD patients and tgAPPSWE mice. Hyperspectral image and cross-sectional emission profile of CAA from s-AD tissue showed dominant q-FTAA emission (A.I and A.II). For 12-month-old (A.III and A.IV) and 18-month-old (A.V and A.VI) tgAPPSWE mice, an age-dependent shift toward q-FTAA emission was observed. MALDI imaging MS (IMS) showed a strong Aβ1–40 signal (B.I) with low Aβ1–42 levels (B.II and B.III) in s-AD brain. In younger tgAPPSWE mice, MALDI IMS verified that both Aβ1–40 (B.IV) and Aβ1–42 (B.V), are present in CAA, showing clear signal colocalization (B.VI). In older mice, CAA consisted mainly of Aβ1–40 (B.VII), with a weak Aβ1–42 signal (B.VIII) with colocalization (B.IX). The number of CAAs analyzed per patient was ∼50, and the number of CAAs analyzed per animal was 15–25. MALDI IMS was performed on consecutive sections to the sections used for LCO imaging and LMPC. Scale bar (A), 25 μm; (B), 75 μm. Intensity scales indicate maximum peak intensities of the MALDI single-ion signal. C, IP-MS mass spectra of parenchymal CAA in 12-month-old (n = 3) (C.I) and 18-month-old tgAPPSWE mice (n = 5) (C.II). The relative amount of Aβ1–42 in relation to the Aβ1–40 peptide differed significantly, and comparative statistics of average ratios reveal a major, significant increase in relative amounts of Aβ1–40 in older mice (18 months) (C.III). 15–25 CAAs were collected from five sagittal sections per animal. Error bars (C.III), S.D. Significance is indicated as follows: **, p < 0.005.

