Figure 4.
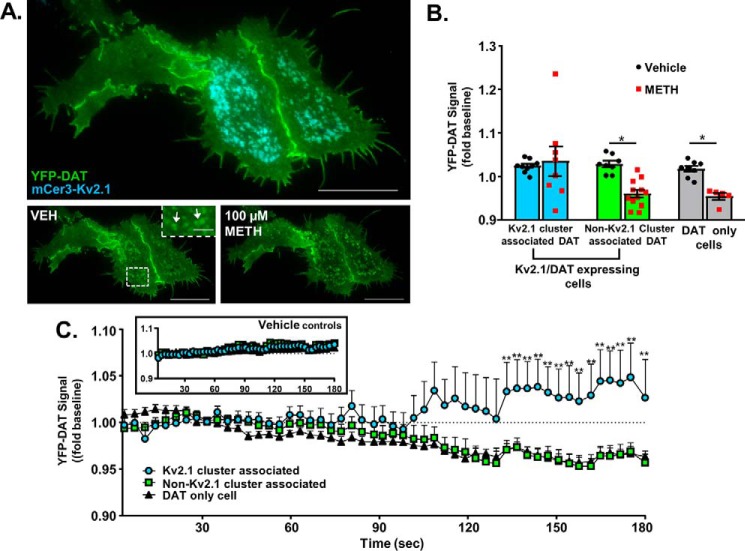
DAT internalization is reduced at sites of Kv2.1 clusters. A, TIRFM image of a Kv2.1/DAT cell (top), and YFP–DAT signal before (below, left) and 2 min after exposure to 100 μm METH (below, right). (Scale bars, 25 μm; inset scale bars, 5 μm.) B, normalized YFP–DAT signal measured during the final 30 s in cells co-expressing mCer3–Kv2.1 (two leftmost groups) and cells expressing YFP–DAT only (rightmost group) following treatment with METH or imaging buffer alone. YFP–DAT signal in cells co-expressing Kv2.1 was segregated on the basis of mCer3–Kv2.1 cluster presence as indicated. Non-Kv2.1 cluster associated DAT and DAT in cells that did not express Kv2.1 exhibited a significant loss of fluorescence at the membrane, indicative of internalization (non-Kv2.1 cluster-associated DAT VEH-METH: p = 0.0037; DAT only cells VEH-METH: p = 0.0414; Sidak's multiple comparison test following two-way ANOVA). Kv2.1 cluster-associated DAT did not exhibit a decrease in fluorescence at the membrane in response to METH treatment. C, line graph showing changes in the YFP–DAT fluorescence levels at the plasma membrane for Kv2.1 cluster associated DAT (blue line), non-Kv2.1 cluster-associated DAT (green line), and DAT-only cells (black line). Non-Kv2.1 cluster associated DAT showed no difference in internalization rate from that in non-Kv2.1–expressing cells, although both groups differed significantly at the indicated time points for Kv2.1 cluster-associated DAT. (**, p < 0.01, Tukey's multiple comparison test following two-way ANOVA.)

