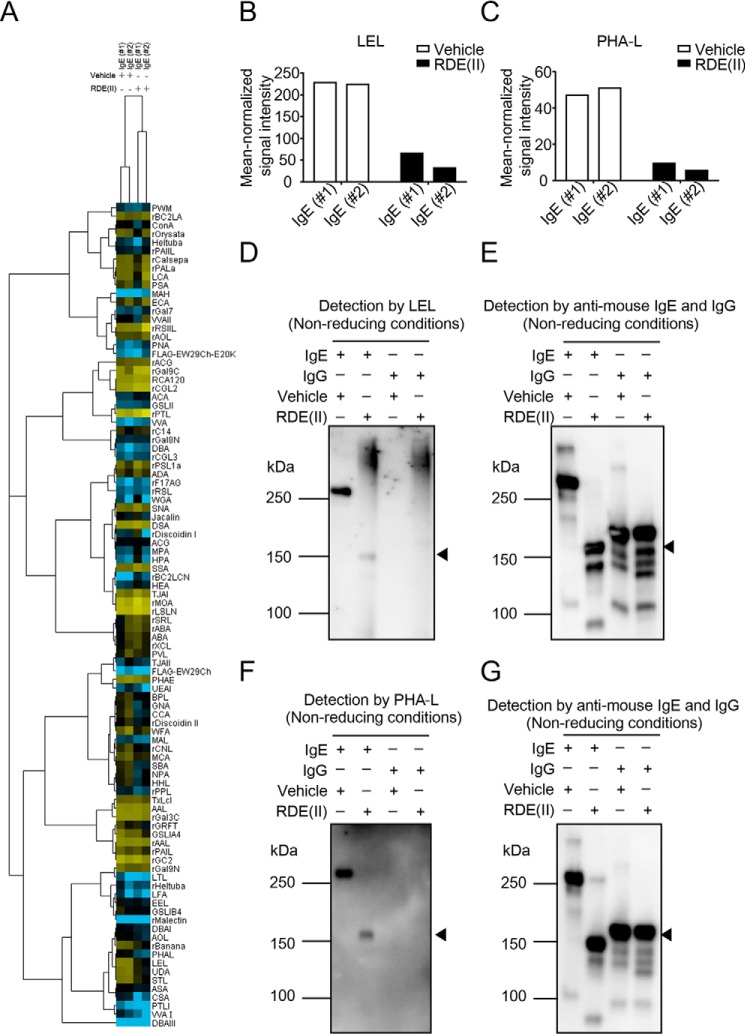
Figure 6.
RDE (II) modulates the glycan on IgE. A, lectin microarray data of RDE (II)–treated IgE (#1 and #2) and -untreated (#1 and #2) were mean-normalized and then analyzed by Cluster 3.0. Clustering method was complete linkage. The heat map with clustering was acquired using Java TreeView. Yellow is positive, and blue is negative. B and C, indicated data (p < 0.01) represent the mean-normalized signal intensities of LEL (B) and PHA-L (C). The sugar residue or oligosaccharide structure in parentheses represents the binding preference. The glycan in parentheses represents carbohydrate specificity for each lectin. #1, anti-TNP IgE (C38-2); #2, anti-DNP IgE. D–G, relationship between the exercises of RDE (II) and the glycan structures. Purified IgE (C38-2) or IgG (15H6) was treated with the RDE (II) overnight (12–20 h). They were blotted under nonreducing conditions. The specimens were analyzed with biotin-conjugated LEL (D) or PHA-L (F), followed by incubation with HRP-conjugated streptavidin. E and G show internal controls for D and F, which are detected with HRP-conjugated anti-mouse IgE and IgG. Data in D to G are representative of two independent experiments.

