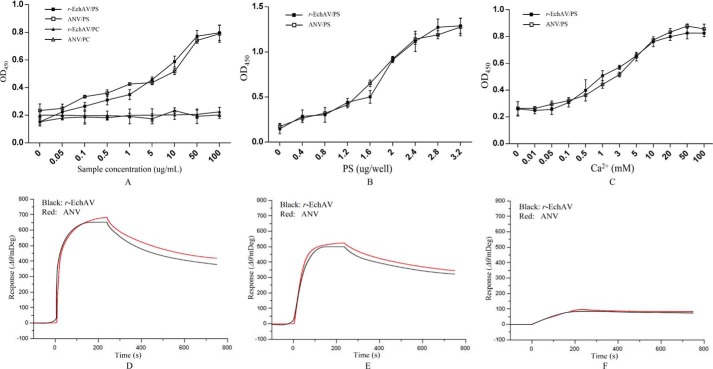
Figure 3.
Binding analysis of r-EchAV to phospholipids. A, binding analysis of r-EchAV to different cell membrane phospholipids. B, binding analysis of r-EchAV to different doses of PS. C, effect of Ca2+ on the binding of r-EchAV to PS. D–F, SPR sensorgrams showing the interaction between phospholipids and r-EchAV (black curves) or ANV (red curves) at a concentration of 640, 160, 40 nm, respectively.

