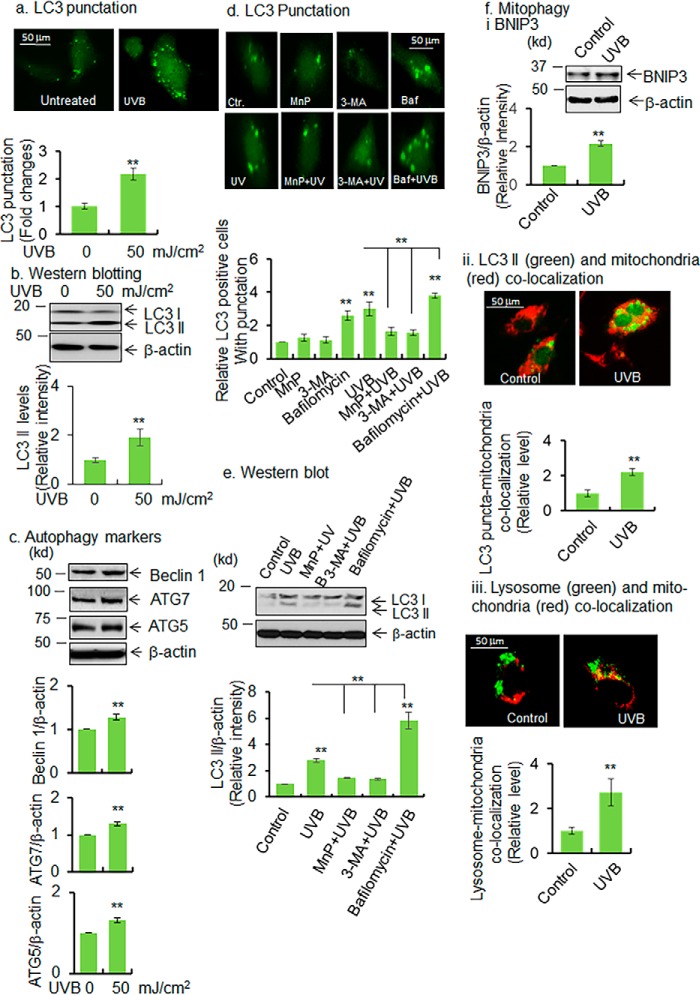
Figure 2.
UVB induces autophagy/mitophagy. a, JB6 cells were transfected with LC3 expression vector using Lipofectamine transfection protocol. LC3 punctation was detected in UVB-treated cells by a fluorescence microscope. For quantification of autophagic response, 100 GFP-positive cells were counted and compared with control, and the data are presented as fold changes. b and c, Western blot analysis was performed to detect LC3 II, beclin 1, ATG7, and ATG5 proteins in UVB-treated cells and compared with control. Bar graph shows the relative levels of each protein upon UVB treatment compared with control. d, autophagy flux was determined by detecting the puncta formation with or without autophagy inhibitors. The bar graph shows the quantification of punctated cells (100 GFP-positive cells were counted for each cell type). e, autophagy flux was also detected by Western blotting in UVB-treated cells following treatment of autophagy inhibitors (MnP, MnTnBuOE-2-PyP5+, 3-MA, and bafilomycin). The bar graph shows the quantification of LC3 II band intensity normalized to β-actin. f, panel i, BNIP3 proteins are detected by Western blotting in UVB-treated JB6 cells as a marker of mitophagy. The bar graph shows the quantification of BNIP3 band intensity normalized with β-actin. Panel ii, increase of mitophagy was observed by detecting the autophagosome (LC3 II) and mitochondria co-localization. One hundred LC3-positive cells were selected, and the number of LC3 puncta was selected, followed by counting the number of co-localized LC3 puncta with mitochondria. The mitochondria and LC3 puncta were identified and arbitrarily gated. The co-localized area is counted as LC3 and mitochondria co-localization. The mitochondria–LC3 co-localized puncta was normalized with the total number of puncta in each cell. Bar graph shows the relative number of LC3–puncta–mitochondrial co-localization in UVB-treated cells compared with control. Panel iii, mitophagy was also monitored by observing mitochondria–lysosome co-localization. Live cells were stained with MitoTracker Red and LysoTracker Green for mitochondria and lysosomes, respectively; the co-localized mitochondria and lysosomes were estimated by counting the number of arbitrarily selected co-localized areas, panel ii. Each experiment was repeated at least three times, and statistical analysis was performed using t tests for two groups or one-way ANOVA followed by Bonferroni's post-test analysis for multiple-group comparisons. Statistical significance is indicated by asterisks: *, p ≤ 0.05, and **, p ≤ 0.01.

