
Figure 3.
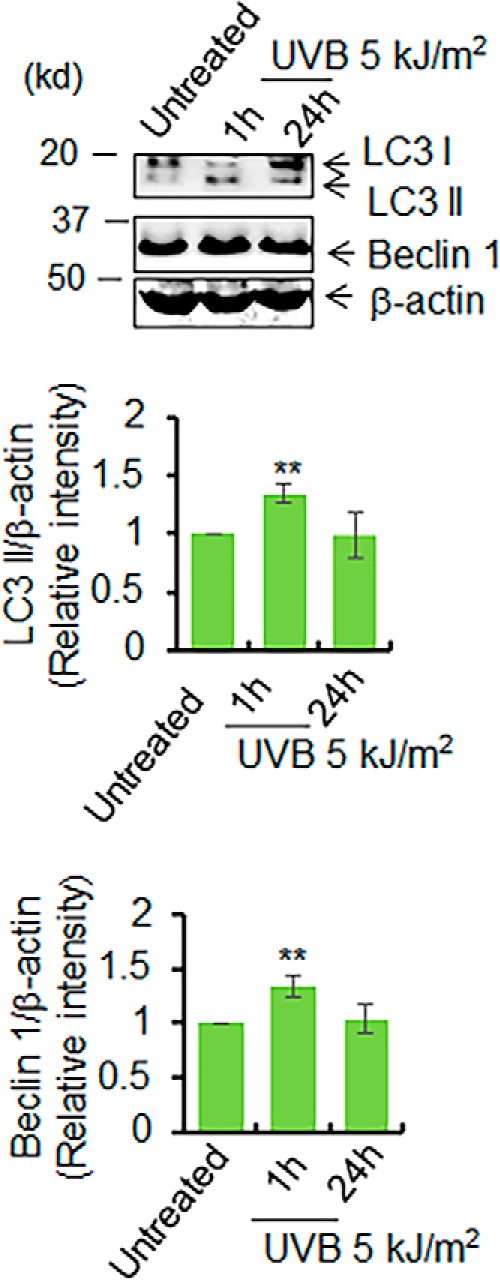
UVB induces autophagy in vivo. The levels of LC3 II formation and beclin 1 were examined in mouse skin tissue lysates after UVB treatment by Western blotting. The bar graph shows the quantification of the band intensity of LC3 II and beclin 1 after normalization with β-actin. Each experiment was repeated at least three times, and statistical analysis was performed using one-way ANOVA followed by Bonferroni's post-test analysis for multiple-group comparisons. Statistical significance is indicated by asterisks: *, p ≤ 0.05, and **, p ≤ 0.01.