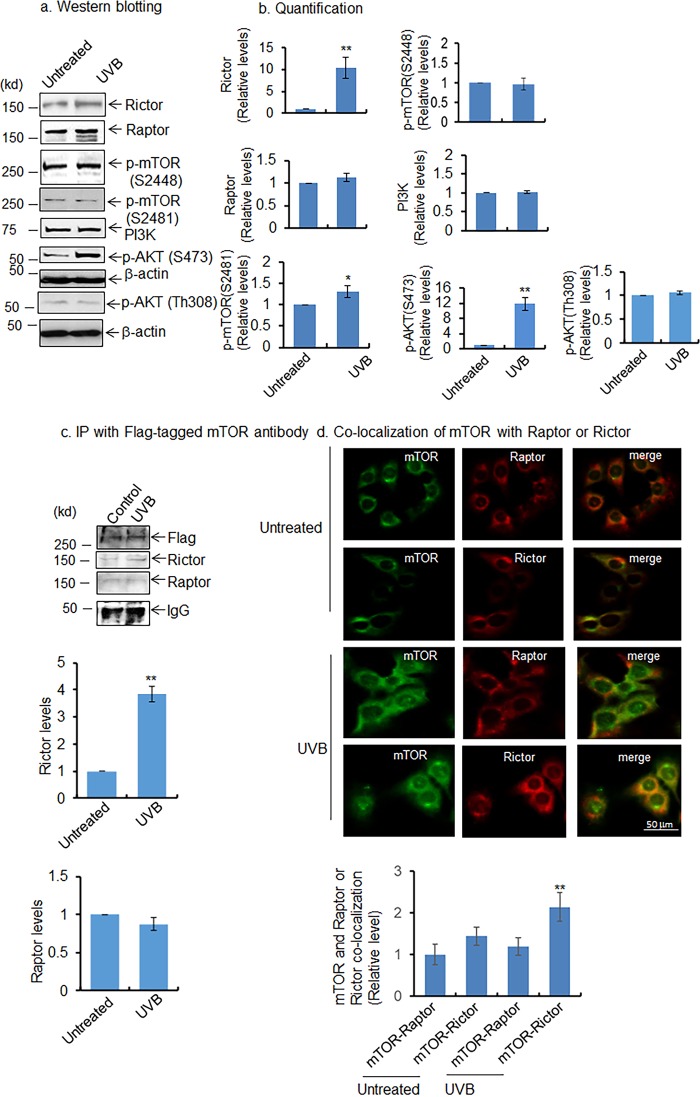
Figure 4.
Activation of AKT/mTORC2 pathway after UVB treatment. a, increased levels of mTOR phosphorylation at Ser-2481, AKT phosphorylation at Ser-473, AKT phosphorylation at Thr-308, and rictor were detected by Western blotting in JB6 cells after UVB treatment. b, quantification of protein band intensity by densitometric scanning; results are normalized with corresponding β-actin band intensity. c and d, co-localization of mTOR with raptor and rictor was detected by immunoprecipitation (IP) with mTOR antibody followed by Western blot analysis (c). Immunocytochemistry was performed using mTOR, raptor, or rictor antibody after UVB treatment. The bar graph represents the relative level of mTOR and raptor co-localization or mTOR and rictor co-localization. For quantification, 100 cells were randomly selected, and the density of the merged image was quantified by densitometric scaning using ImageJ software (d). Each experiment was repeated at least three times, and statistical analysis of the quantifications was performed using t test. Statistical significance is indicated by asterisks: *, p ≤ 0.05, and **, p ≤ 0.01.

