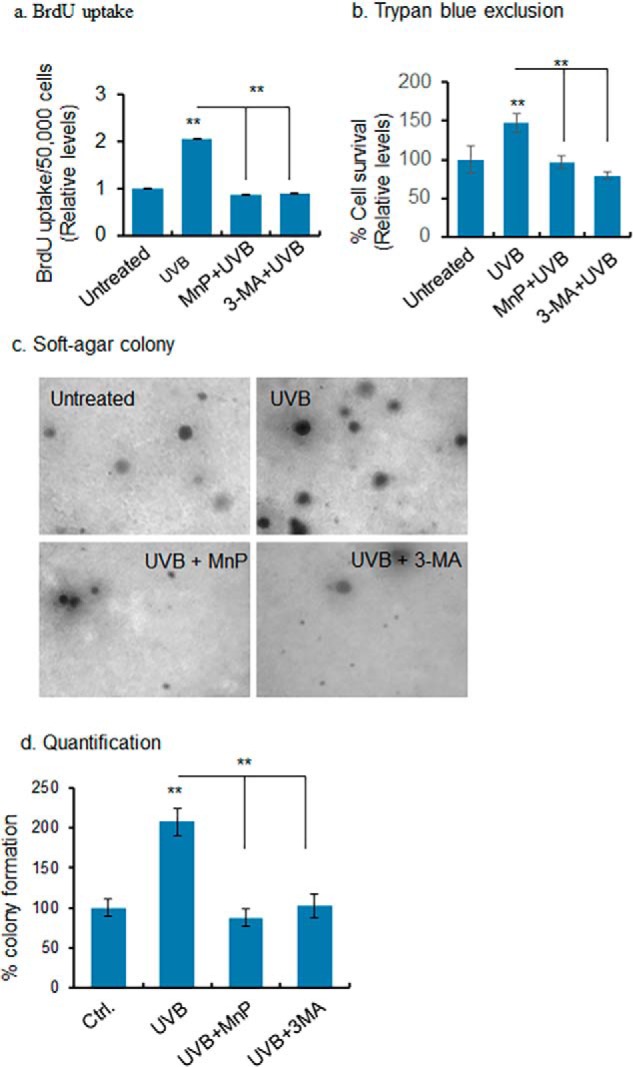
Figure 7.

Autophagy-dependent UVB-induced cell proliferation. a, BrdU uptake was determined as a measure of cell growth in UVB-treated cells with or without ROS or autophagy inhibitors. b, cell survival was assessed by counting the cells following UVB treatment using trypan blue exclusion assay. c, soft agar colony formation assay assessed cell growth after UVB treatment with or without ROS and autophagy inhibitor. For each treatment, 6–10 dishes were used, and microscopic images of transformed colonies were taken from six randomly selected fields in each dish (6–10 dishes/group). A representative microscopic view is shown. d, number of transformed colonies was counted and presented as a bar graph. Each experiment was repeated at least three times, and statistical analysis was performed using one-way ANOVA followed by Bonferroni's post-test analysis for multiple-group comparisons. Statistical significance is indicated by asterisks: *, p ≤, 0.05 and **, p ≤ 0.01.
