Figure 6.
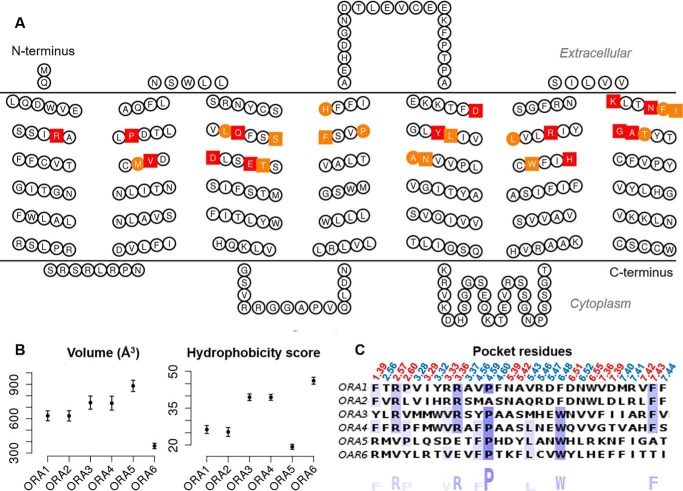
ORA pocket residues and properties. A, snake-plot of ORA5 with pocket residues colored: those predicted to be within 3 Å of LCA are squares, whereas those verified by mutagenesis are colored in red. B, pocket volume and hydrophobicity assessed with 100 in silico models of each ORA. Error bars represent mean ± S.E. C, pocket residues of the six ORAs with Ballesteros-Weinstein notation above and consensus sequence logo underneath.

