Figure 8.
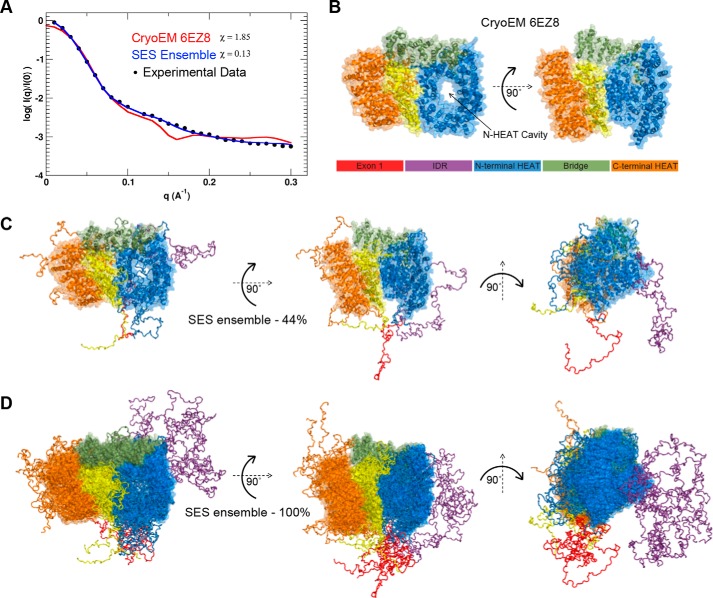
Fitting SAXS data to structural models of HTT–HAP40 complex. A, experimental SAXS profiles (black circles) plotted with the theoretical profile for the EM structure of the HTT–HAP40 complex (red line) and the predicted profile averaged over the optimal SES ensemble (blue line). Surface representation of the EM structure (B) as well as the most populated (∼44%) solution model (C) and complete ensemble of the HTT–HAP40 complex (D) are shown with surface representation of the globular regions and backbone trace of the flexible regions (color key as in B).

