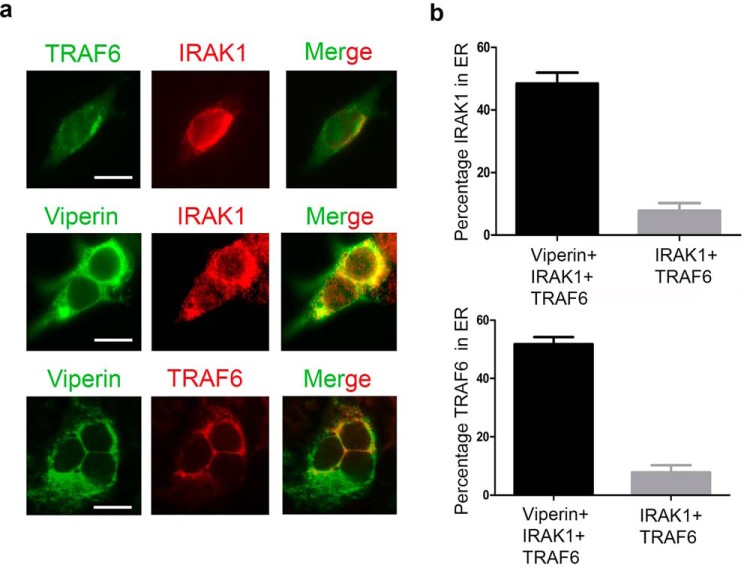
Figure 4.
Relocalization of IRAK1 and TRAF6 to the endoplasmic reticulum by viperin. 293T cells were transiently transfected with viperin and/or IRAK1 and TRAF6. 36 h post-transfection, cells were fixed in 4% paraformaldehyde, permeabilized with 0.05% Triton X-100, and immunostained for viperin, IRAK1, and TRAF6 as described under “Experimental procedures.” Images shown are representative of n = 10 cells. Scale bar = 5 μm. a, top panels: cells co-transfected with IRAK1 (red) and TRAF6 (green) show diffuse expression throughout the cell. Middle panels: cells were co-transfected with IRAK1, TRAF6, and viperin. Staining for viperin (green) and IRAK1 (red) demonstrates co-localization (yellow) of viperin and IRAK1. Bottom panels: cells were co-transfected with IRAK1, TRAF6, and viperin. Staining for viperin (green) and TRAF6 (red) demonstrates co-localization (yellow) of viperin and TRAF6. Co-expression of IRAK with viperin appears to result in IRAK1 also forming punctate structures that do not co-localize (middle panels). The reason for this is unclear. b, the re-localization of IRAK1 and TRAF6 to the ER induced by viperin was quantified, with the co-localization of IRAK1 and TRAF6 with the ER protein, calnexin, used as a measure of ER association. Top panel: the percentage of total IRAK1 that co-localizes to the ER in the presence or absence of viperin. Bottom panel: the percentage of total TRAF6 that co-localizes to the ER in the presence or absence of viperin. Results are presented as mean ± S.E. of at least 10 different cells.

