Figure 4.
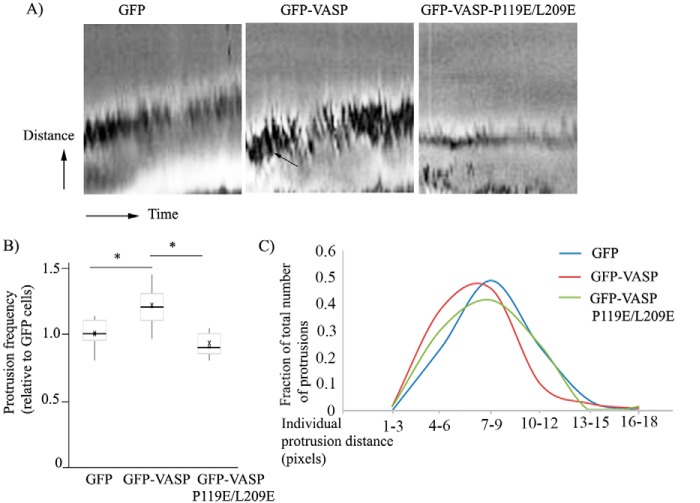
VASP regulates protrusion dynamics through its interaction of Pfn1. A, representative kymograph images revealing the protrusion dynamics of MDA-231 cells stably expressing either GFP, GFP-VASP, or GFP-VASP-P119E/L209E (horizontal axis, time (total duration, 10 min); vertical axis, distance (the sawtooth pattern indicates individual protrusion and retraction events of the membrane; ruffles are indicated by the arrow). B, box-and-whisker plot summarizing the protrusion frequency (number of protrusions recorded within a 10-min time period) of different groups of cells relative to GFP expressers. C, relative occurrence of protrusion events for different ranges of protrusion distance (as indicated in pixels) of various groups of cells. These data are based on analyses of all protrusions detected at approximately three different locations at the leading edge per cell from at least 15 cells/group (*, p < 0.05).

