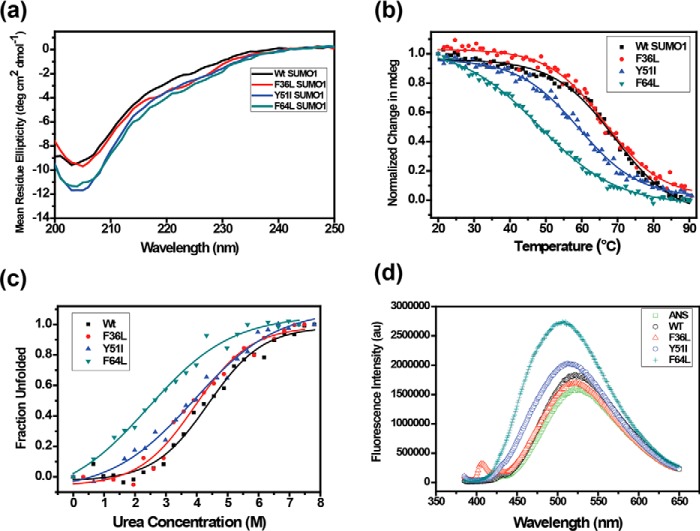
Figure 2.
a, far UV circular dichroism spectra showing conserved secondary structure for wt and SUMO1 mutants. b, temperature melts for SUMO1 aromatic mutants. Change in mean ellipticity is normalized and plotted against temperature. c, urea-induced denaturation melt for each mutant. Normalized mean ellipticity shift is plotted against urea concentration. d, the plot of steady-state ANS fluorescence intensity upon binding with wt and mutant proteins.

