Figure 5.
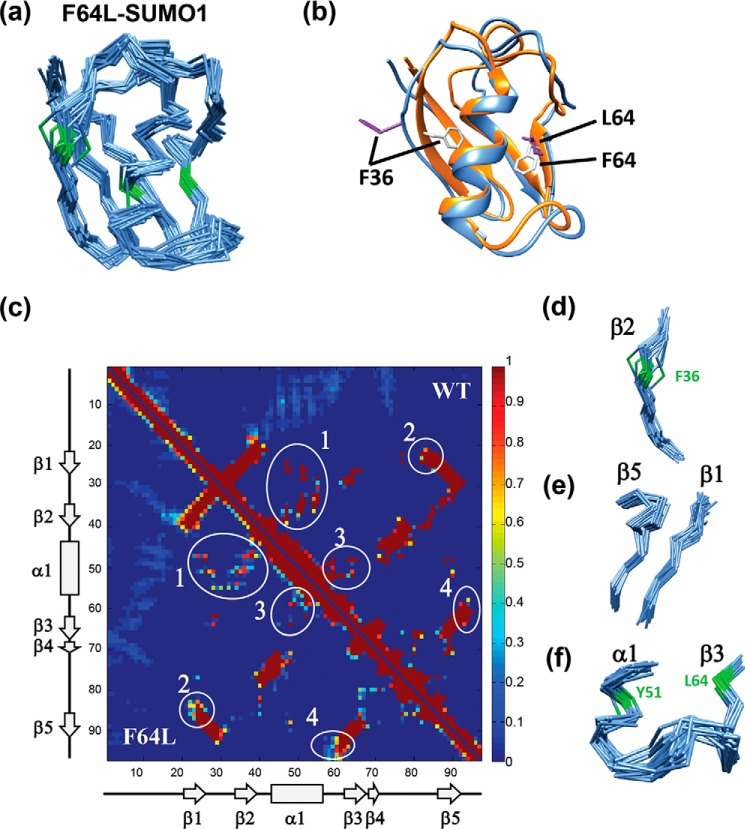
Solution structure of F64L-SUMO1. a, the backbone Cα chain of the 20 lowest energy structures of F64L-SUMO1 is shown, colored in blue. Phe36-Tyr51-Phe64 backbone Cα atoms and bonds are colored green. b, the lowest energy structure of wt-SUMO1 (PDB 2N1V) and the mutant is compared. Ribbons are colored in orange and blue, for the wt-SUMO1 and F64L-SUMO1, respectively. The Phe36 and Phe64 side chains are shown in gray and purple for WT and mutant, respectively. c, the contact map of WT and F64L SUMO1 is shown in the same 2D plot, where WT is represented in the upper right, and the F64L is represented in the lower left region of the plot. The major differences between the contacts are circled and labeled. The areas 1, 2, and 4 in c are shown in d–f, respectively.

