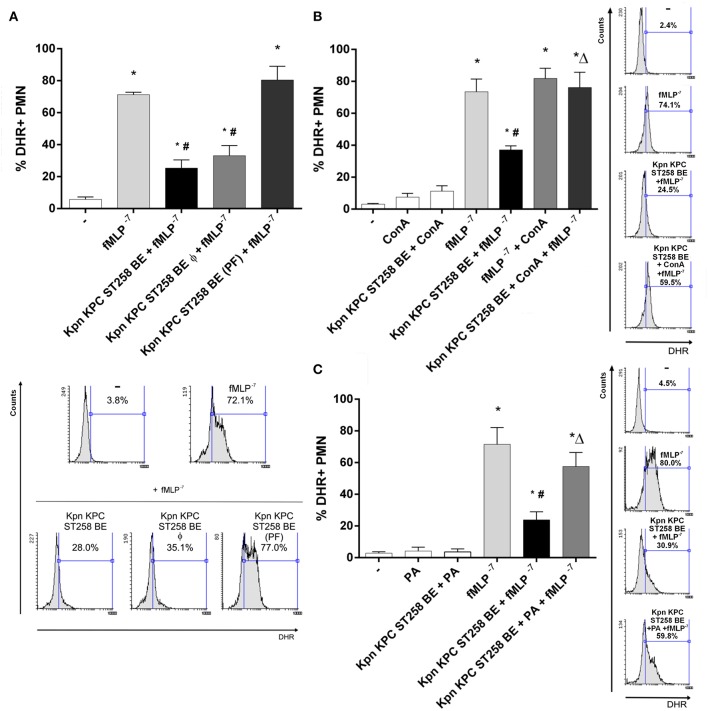
Figure 7.
Unraveling the nature of the inhibitory component in KPC ST258 BE. (A) fMLP-triggered ROS was measured in PMN in the presence of heat-treated (Φ) KPC ST258 BE or in protein-precipitated fractions (PF). Results of the % of DHR+ PMN were expressed as the mean ± SEM. Lower panel: representative histogram showing SSC vs. DHR. n = 7. *p < 0.05 vs. untreated (-); # p < 0.05 vs. fMLP−7. (B) Mannose-containing molecules in KPC ST258 BE were depleted by precipitation with Concanavalin A (Con A) and this depleted fraction was assayed for its inhibitory potential in fMLP-induced ROS. The % of DHR+ PMN is shown and results were expressed as the mean ± SEM, n = 7. *p < 0.05 vs. untreated (-); # p < 0.05 vs. fMLP−7; Δp < 0.05 vs. Kpn KPC ST258 BE + fMLP−7. Right panel: Representative histograms showing SSC vs. DHR. (C) Oxidation of polysaccharides in KPC ST258 BE was performed by periodic acid (PA) treatment and ROS was triggered by fMLP in the presence of these oxidized-BE. Results (% of DHR+ PMN) were expressed as the mean ± SEM. n = 5. *p < 0.05 vs. untreated (-); # p < 0.05 vs. fMLP−7; Δp < 0.05 vs. Kpn KPC ST258 BE + fMLP−7. Right panel: Representative histograms showing SSC vs. DHR.

