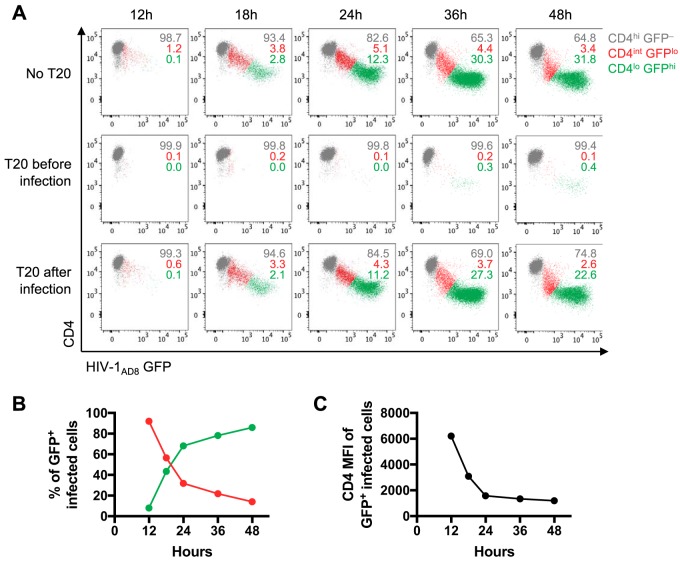
FIG 1.
CD4 downregulation and GFP expression over time in CEM cells infected with HIV-1AD8. (A) Flow cytometry scatter plots depicting CD4 and HIV-1AD8 (GFP) expression over 12 to 48 h. The top panel shows HIV-1AD8-infected CEM cells in the absence of T20. The middle and bottom panels show CEM cells treated with 10 μg/ml of T20 before or 4 h after spinoculation with HIV-1AD8. The numbers represent the proportions of CD4hi GFP–, CD4int GFPlo, and CD4lo GFPhi cells, as indicated. (B) The proportions of CD4int and CD4lo GFP+ infected CEM cells over time. (C) CD4 expression in terms of median fluorescence intensity (MFI) on GFP+ infected CEM cells over time. The data in panels B and C were averaged from four independent experiments.

