FIG 2.
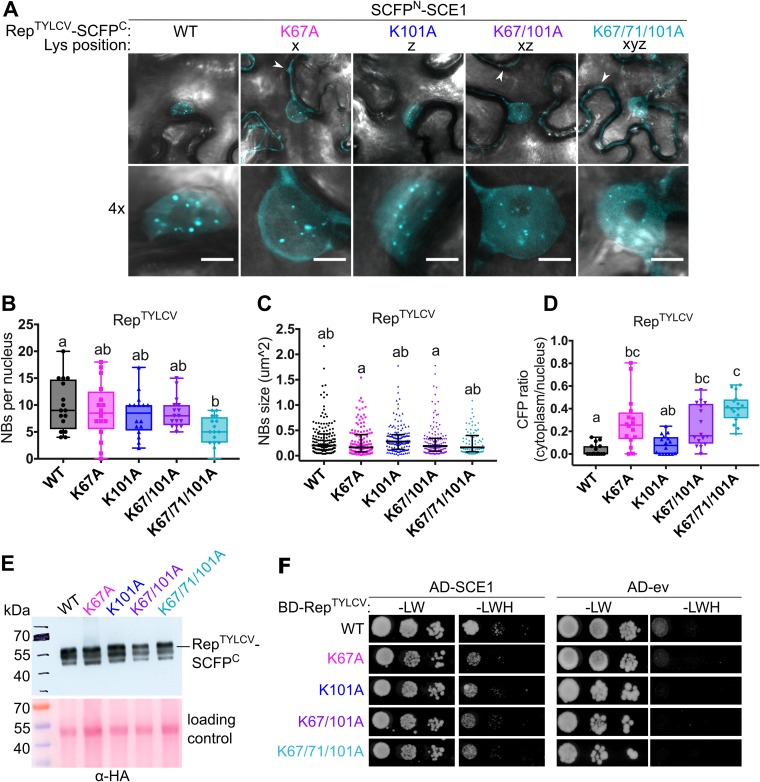
The conserved lysines do not determine the RepTYLCV interaction with SCE1. (A) BiFC showing the nuclear localization of the RepTYLCV-SCE1 protein complex in nuclear foci/nuclear bodies (NBs). The image shown represents a typical N. benthamiana epidermal cell (top) and a 4× zoom showing its nucleus (bottom); white arrowheads highlight the BiFC signal in the cytoplasm. Scale bars represent 5 μm. (B) Box plot depicting the number of NBs per nucleus in the cells expressing the indicated Rep variants (x axis) as a BiFC pair together with SCE1. (C) As for panel B except that the scatter plot represents the size of the NBs. (D) Box plot depicting the CFP fluorescence intensity ratio in the cytoplasm versus the nucleus for the images shown in panel A. For all plots, a total of 16 cells per sample (n = 16) was analyzed. In the box plots, horizontal bars, boxes, whiskers, and dots represent median, interquartile range (IQR), data range from the minimum to the maximum, and each individual value, respectively; in the scatter plot, the horizontal bar, whiskers, and dots indicate median, IQR, and each individual value, respectively. A Kruskal-Wallis statistical test was performed, followed by a Dunn post hoc test for each data set; the letters denote statistically significantly different groups (P < 0.05). (E) Analysis of protein levels of WT Rep-SCFPC and its variants using an anti-HA immunoblot (the HA tag is positioned between Rep and SCFPC). To demonstrate equal protein loading, the membranes were stained with Ponceau S. (F) Yeast two-hybrid assay between BDGAL4-RepTYLCV variants and ADGAL4-SCE1 (left) or ADGAL4-empty vector (ev) (right). –LW, control plate for yeast growth; –LWH, selection plate with medium to test for the interaction. All mutants tested retained their interaction with SCE1 and did not autoactivate the yeast reporter gene.

