FIG 3.
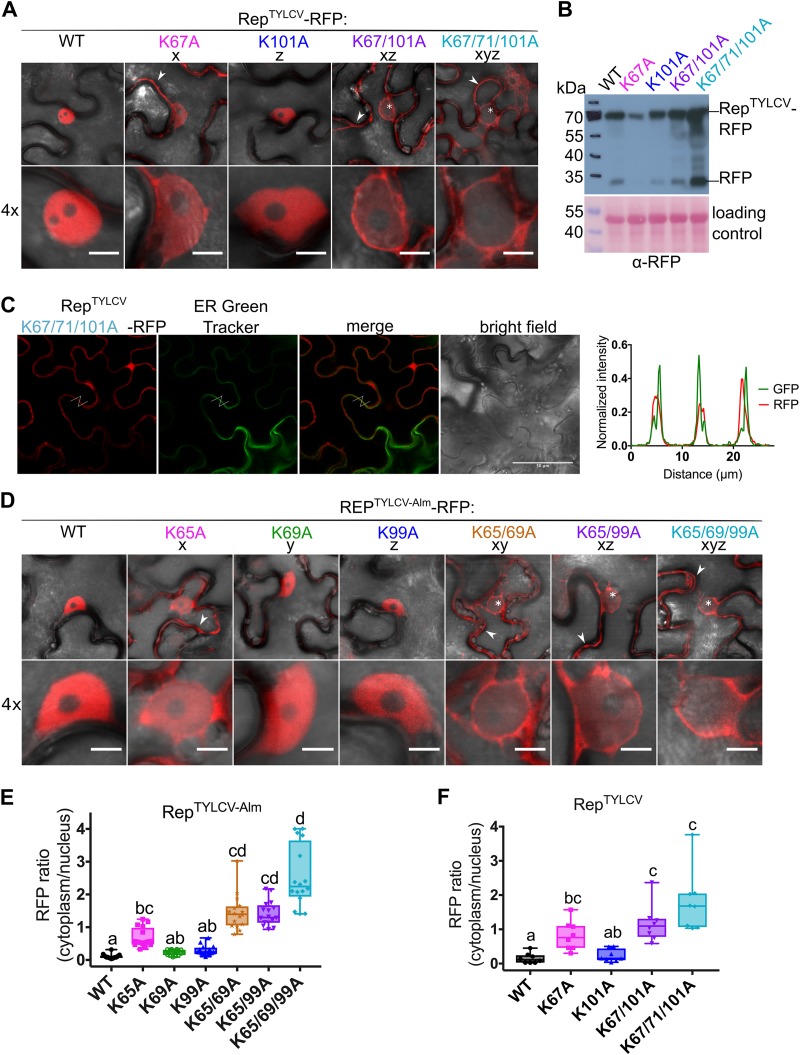
Nuclear localization of Rep from two TYLCV strains is controlled by the conserved lysines. (A) Subcellular localization of RFP-tagged RepTYLCV (TYLCV-Alb13) variants in N. benthamiana upon transient expression with Agrobacterium. Arrowheads indicate fluorescence in the cytoplasm, and asterisks mark nonfluorescent or weakly fluorescent nuclei. Scale bars represent 5 μm. (B) Immunoblot of the Rep-RFP fusion proteins upon transient expression in N. benthamiana. Proteins were detected with an anti-RFP antibody. To demonstrate equal protein loading, the membranes were stained with Ponceau S. (C) Micrographs of epidermal leaf cells transiently expressing RepTYLCV K-to-A triple mutant-RFP and stained with ER-Tracker Green. From the left in order: RFP channel, ER-Tracker, merge of RFP and ER-Tracker, bright field, and graph representing the normalized fluorescence intensity of RFP and ER-Tracker (GFP) along the lines in the micrographs. Note that the two signals are shifted and do not overlap, indicating that they localize in different positions. Scale bars represent 50 μm. (D) Subcellular localization of RFP-tagged Rep TYLCV-Almeria WT and K-to-A variants in N. benthamiana. For each sample, one representative epidermal cell is shown with a 4× zoom of its nucleus; arrowheads indicate fluorescence in the cytoplasm, and asterisks mark nonfluorescent or weakly fluorescent nuclei. The scale bars represent 5 μm. (E) Box plot showing the RFP fluorescence intensity ratio in the cytoplasm versus nucleus for the images shown in panel D; a total of 16 cells were analyzed. (F) Box plot depicting the RFP fluorescence intensity ratio in the cytoplasm versus nucleus for the images shown in panel A; a total of 8 cells per sample were analyzed. The statistical analysis used is described in the legend to Fig. 2.

