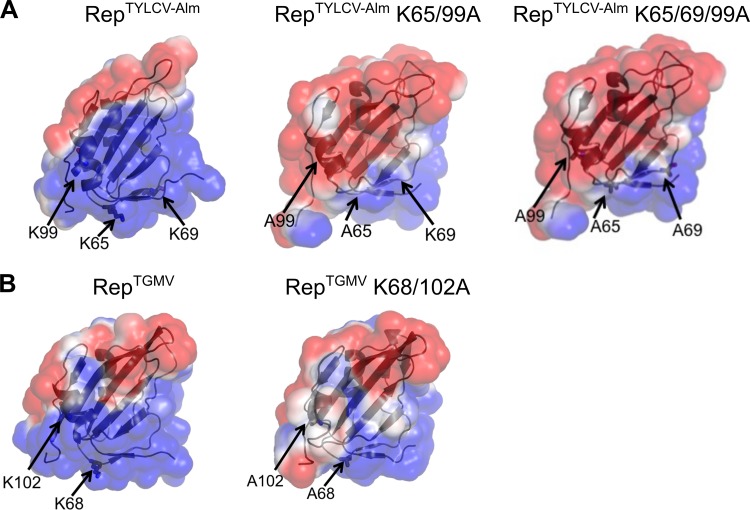
FIG 5.
Structural models of RepTYLCV-Alm and RepTGMV reveal that the three lysines together constitute a positively charged surface area in RepTYLCV-Alm. (A) Electrostatic surface plots of WT RepTYLCV-Alm (left), RepTYLCV-Alm K65/99A (center), and RepTYLCV-Alm K65/69/99A (right) (residues 4 to 121). (B) Electrostatic surface plots of WT RepTGMV (left) and RepTGMV K68/102A (right) (residues 4 to 121). Electrostatic surface plots of the protein models were created using the Adaptive Poisson-Boltzmann Solver in PyMOL. Blue denotes the positively charged electrostatic surface, while red denotes negatively charged areas.

