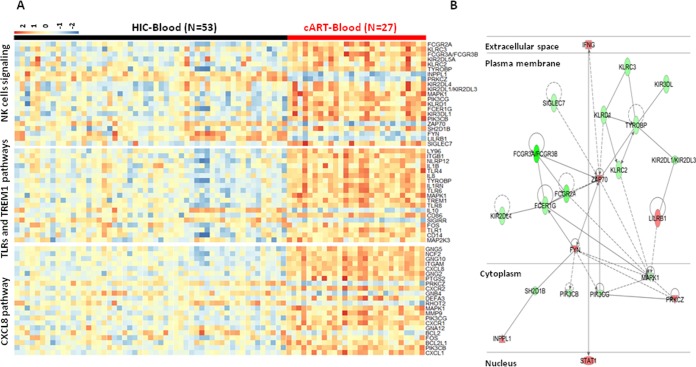
FIG 1.
Gene expression in HIC and cART patients in whole blood. (A) Heatmap of genes belonging to the main pathways associated with differentially expressed genes in whole blood of HIC and cART patients, including NK cells, TLRs, and TREM1 and CXCL8 pathways. (B) Relationships between genes differentially expressed in whole blood of HIC compared to cART patients. Red symbols are overexpressed genes in HIC compared to cART patients; green symbols are underexpressed genes. Solid lines represent direct links between genes, and dashed lines represent indirect links (with no more than one gene between the two genes).

