FIG 3.
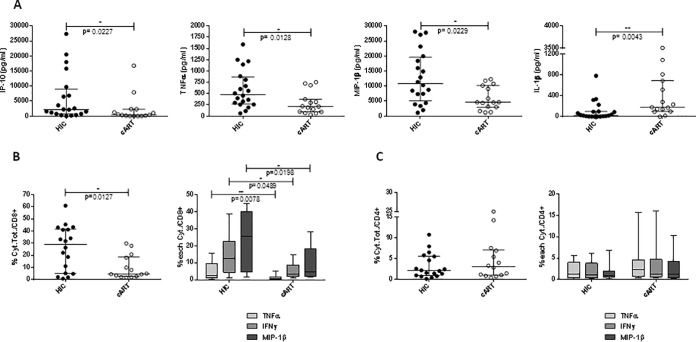
Cytokine profiles of PBMC from HIC and cART patients stimulated in vitro with HIV peptides covering Gag, Pol, and Nef antigens. (A) Cytokine measurements (pg/ml) in supernatants of stimulated PBMC from HIC (n = 20) and cART patients (n = 15). Cytokine secretion was measured in supernatants after HIV peptide stimulation of PBMC using Bio-Plex 200 system (Bio-Rad) at day 2 of stimulation for IP-10 and IL-1β and at day 9 after a restimulation for 24 h for TNF-α and MIP-1β. (B and C) CD8 and CD4 T-cell-producing cytokines after PBMC stimulation with HIV peptides for 9 days, as measured by ICS. (B) Frequency of CD8 T cells producing TNF-α, IFN-α, and MIP-1β (the sum of the cytokines or individual cytokines) in 18 HIC and 14 cART patients. (C) Frequency of CD4 T cells producing TNF-α, IFN-γ, and MIP-1β (the sum of the cytokines or individual cytokines) in 18 HIC and 14 c-ART patients. Horizontal lines represent the medians ± the interquartile ranges (IQR), and a Mann-Whitney test was applied.

