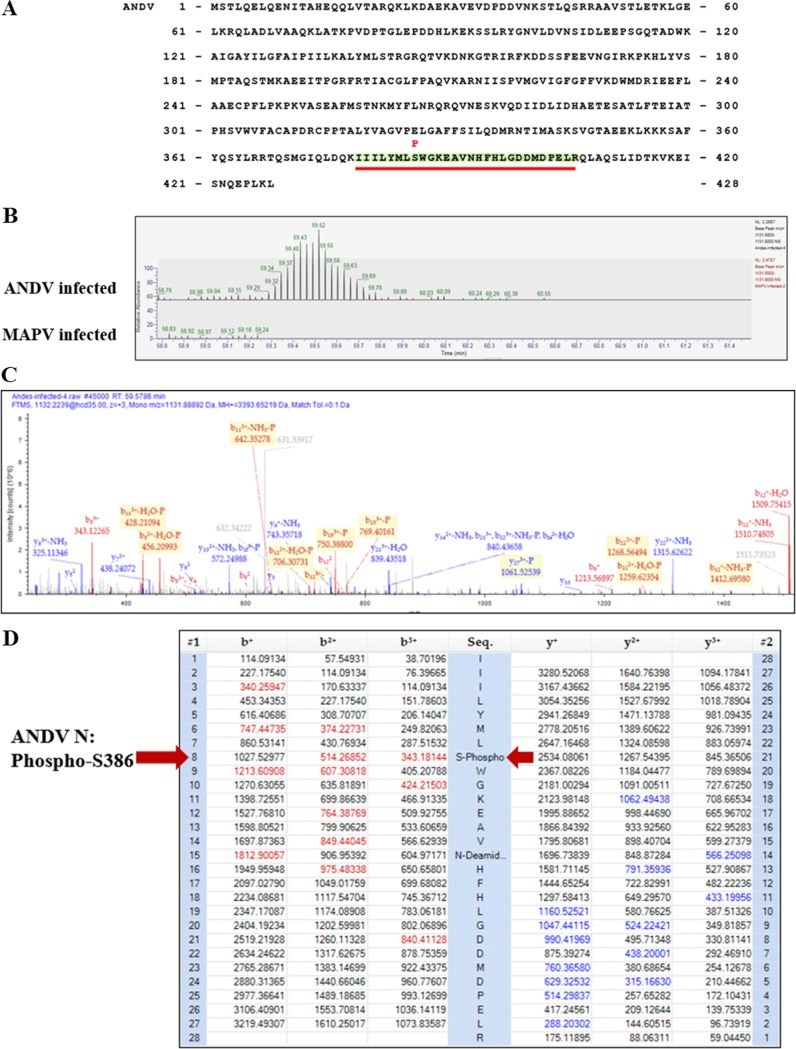
FIG 10.
Mass spectroscopy analysis of N protein phosphorylation in infected cells. VeroE6 cells were ANDV or MAPV infected at an MOI of 0.5, and cell lysates were harvested at 3 dpi in 1% NP-40 lysis buffer. Lysates were centrifuged at 18,000 × g, and N protein was immunoprecipitated with anti-N antibody and protein A/G agarose. Samples were washed once in TBST, twice in TBS, and twice with Optima LC/MS-grade water (Thermo Fisher). Nano-liquid chromatography-tandem mass spectroscopy (nLC/MS-MS) was performed on tryptic peptides of ANDV and MAPV N proteins. nLC/MS-MS and tryptic peptide spectrum analysis identified phosphorylated S386 with high confidence from 12 separate peptides containing residues 379 to 406 of the ANDV N protein. (A) Location of the phospho-S386-containing peptide in the ANDV N protein. (B) nLC/MS-MS of ANDV N protein phosphorylation. The mass spectra define phosphorylated serine 386 in a representative ANDV N peptide from residues 379 to 406 compared to H386-containing MAPV N peptide, determined using Proteome Discoverer software. (C and D). Representative nLC/MS-MS spectra (C) and ion table data (D) from 1 of 12 tryptic peptide spectral matches identified by Proteome Discoverer software.

