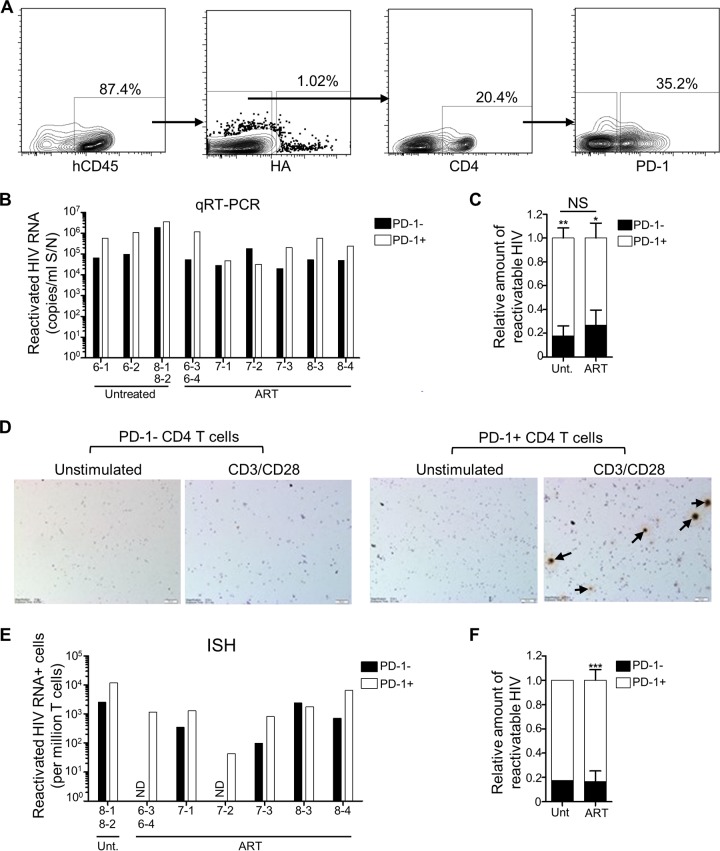
FIG 5.
Latent and reactivatable HIV-1 is enriched in PD-1+ CD4 T cells. Humanized mice generated from three different cohorts (cohorts 6 to 8) were infected with NL4-3-HA and then either left untreated (n = 4) or switched to oral ART (n = 7). Mouse IDs are denoted on the x axes of relevant graphs. After necropsy, HA– CD45+ CD4+ PD-1+ and HA– CD45+ CD4+ PD-1– subsets of spleen cells were sorted by FACS, and equal numbers were plated and cultured in either unstimulating or CD3/CD28 stimulating conditions for the ex vivo latency assay. (A) Representative FACS plots showing the HA– CD45+ CD4+ PD-1+ and HA– CD45+ CD4+ PD-1– T cell sorting. (B) Reactivated HIV-1 RNA in culture supernatants for PD-1– and PD-1+ subsets from the indicated mice. Due to low recovery, some samples from individual mice were pooled, as indicated. Reactivated HIV values were calculated by subtracting the values from unstimulated cultures from the values of the matched stimulated cultures. (C) Distribution of reactivatable HIV-1 from the qRT-PCR analysis between PD-1+ and PD-1– subsets for samples from untreated and ART-treated mice, shown as means ± the SEM for each treatment group (*, P < 0.05; **, P < 0.01). Differences in the percent distributions between the two treatment groups were not significant (NS). (D) Cell pellets from ex vivo latency assay cultures were analyzed for HIV-1 RNA by ISH. Representative images from one mouse (ID 8-4) are shown, with arrows indicating the HIV-1 RNA+ cells. (E) HIV-1 RNA+ cells from each ISH sample were counted and converted to HIV+ cells/million. Due to low recovery, some cells from individual mice were pooled, as indicated. Values were calculated by subtracting the values from unstimulated cultures from the values of the matched stimulated cultures. ND, not detected. (F) Distribution of reactivatable HIV-1 from the ISH analysis between PD-1+ and PD-1– subsets of samples from untreated (n = 1) and ART-treated (n = 6) mice (means ± the SEM; ***, P < 0.001).

