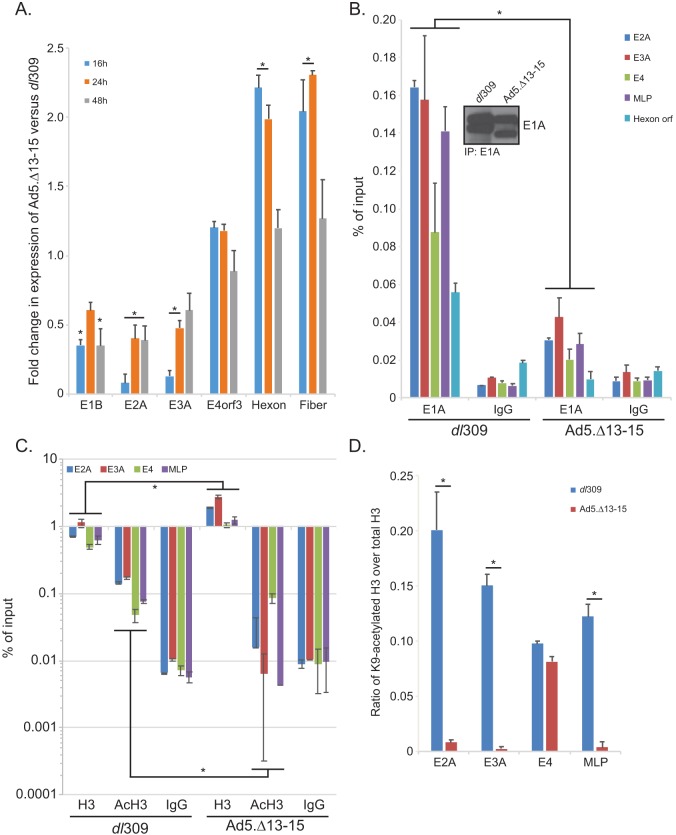
FIG 5.
E1A interaction with E4orf3 affect expression of viral early genes and influences viral chromatin structure. (A) IMR-90 cells were grown until confluence, at which point medium was replaced and the cells were allowed to grow for another 72 h. At that point cells were infected with either dl309 or Ad5.Δ13-15 at an MOI of 30 for 1 h, after which the saved medium originally removed from the cells was reapplied. Cells were then incubated for the indicated time, after which RNA was extracted using the TRIzol reagent, converted to cDNA using SuperScript VILO, and analyzed for expression using real-time quantitative PCR (qPCR) with the Bio-Rad CFX96 instrument and ABI SuperMix for CFX reagent. Analysis of expression was performed using the Pfaffl method, comparing the expression in Ad5.Δ13-15-infected cells to that in dl309-infected cells. Expression of GAPDH was used to normalize the results. Statistically significant differences (P value < 0.05) between the two viruses are indicated with an asterisk. Error bars represent SDs from three biological replicates. (B) IMR-90 cells treated in the same manner as for panel A were fixed with paraformaldehyde 24 h after infection, and chromatin was immunoprecipitated using an anti-E1A antibody cocktail consisting of an equal mix of M58 and M73 hybridoma supernatants or a rabbit anti-rat IgG control antibody. Promoter occupancy of E1A was assayed using real-time qPCR using ABI SuperMix for CFX with a Bio-Rad CFX96 real-time instrument. The inset shows total E1A immunoprecipitated from the samples. Results are represented as percentage of input. Statistically significant differences (P value < 0.0001) between the two viruses are indicated with an asterisk. Error bars represent SDs from two biological replicates. (C) The same cells as used for panel B for E1A immunoprecipitation were used to immunoprecipitate histone H3 or K9-acetylated histone H3. Data are represented as percentage of input, and error bars represent SDs from two biological replicates. Statistically significant differences (P value ≤ 0.0472) between the two viruses are indicated with an asterisk. (D) Data presented in panel C were used to calculate the ratio of K9-acetylated H3 (AcH3) to total H3, which is represented on the bar chart. Statistically significant differences (P value < 0.0001) between the two viruses are indicated with an asterisk. Error bars represent SDs from two biological replicates.

