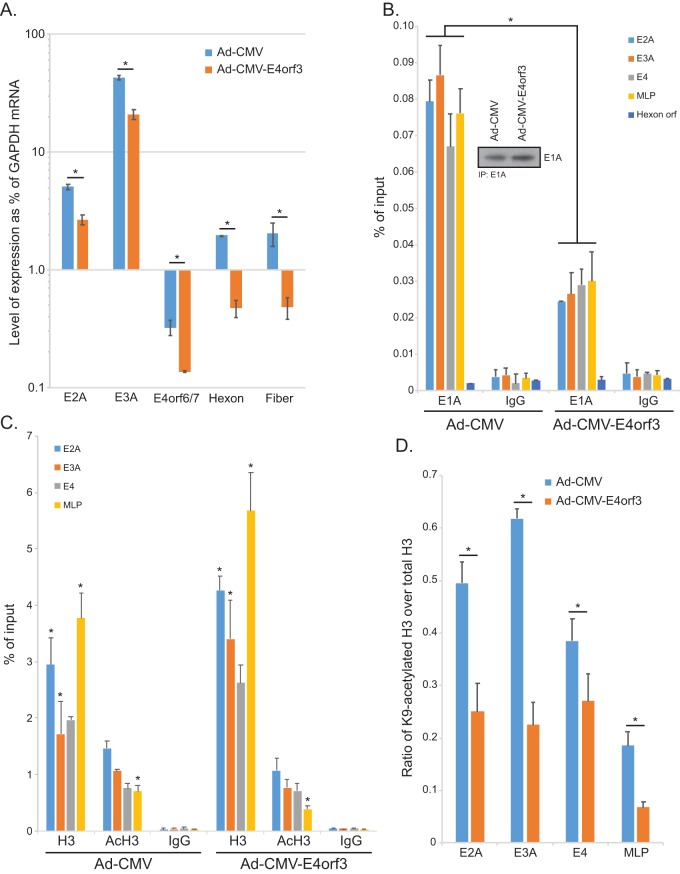
FIG 6.
E4orf3 inhibits viral gene expression and affects viral chromatin organization. (A) A549-E1A289R cells that stably express HAdV5 E1A289R were infected with either Ad-CMV, which expresses no E1A or E4orf3, or Ad-CMV-E4orf3, which expresses an HA-tagged E4orf3 protein. Sixteen hours after infection, total RNA was extracted using the TRIzol reagent, converted to cDNA using SuperScript VILO, and analyzed for expression using real-time qPCR with the Bio-Rad CFX96 instrument and ABI SuperMix for CFX reagent. Analysis of expression was determined as percentage of the GAPDH mRNA level. Since E4orf3 was provided by the virus and Ad-CMV has no extra copy of the E4orf3 gene, we used E4orf6/7 to analyze the expression from the E4 transcriptional unit. Statistically significant differences (P value ≤ 0.0123) between the two viruses are indicated with an asterisk. Error bars represent SDs from three biological replicates. (B) A549-E1A289R cells were infected at an MOI of 10 for 24 h. Cells were subsequently fixed with paraformaldehyde 24 h after infection, and chromatin was immunoprecipitated using an anti-E1A antibody cocktail consisting of an equal mix of M58 and M73 hybridoma supernatants or a rabbit anti-rat IgG control antibody. Promoter occupancy of E1A was assayed using real-time qPCR using ABI SuperMix for CFX with a Bio-Rad CFX96 real-time instrument. The inset shows total E1A immunoprecipitated from the samples. Results are represented as percentage of input. Statistically significant differences (P value < 0.0001) between the two viruses are indicated with an asterisk. Error bars represent SDs from two biological replicates. (C) The same cells as used for panel B for E1A immunoprecipitation were used to immunoprecipitate histone H3 or K9-acetylated histone H3. Data are represented as percentage of input, and error bars represent SDs from two biological replicates. Statistically significant differences (P value ≤ 0.0422) between the two viruses are indicated with an asterisk. (D) Data presented in panel C were used to calculate the ratio of AcK9 H3 to total H3, which is represented on the bar chart. Statistically significant differences (P value < 0.05) between the two viruses are indicated with an asterisk. Error bars represent SDs from two biological replicates.

