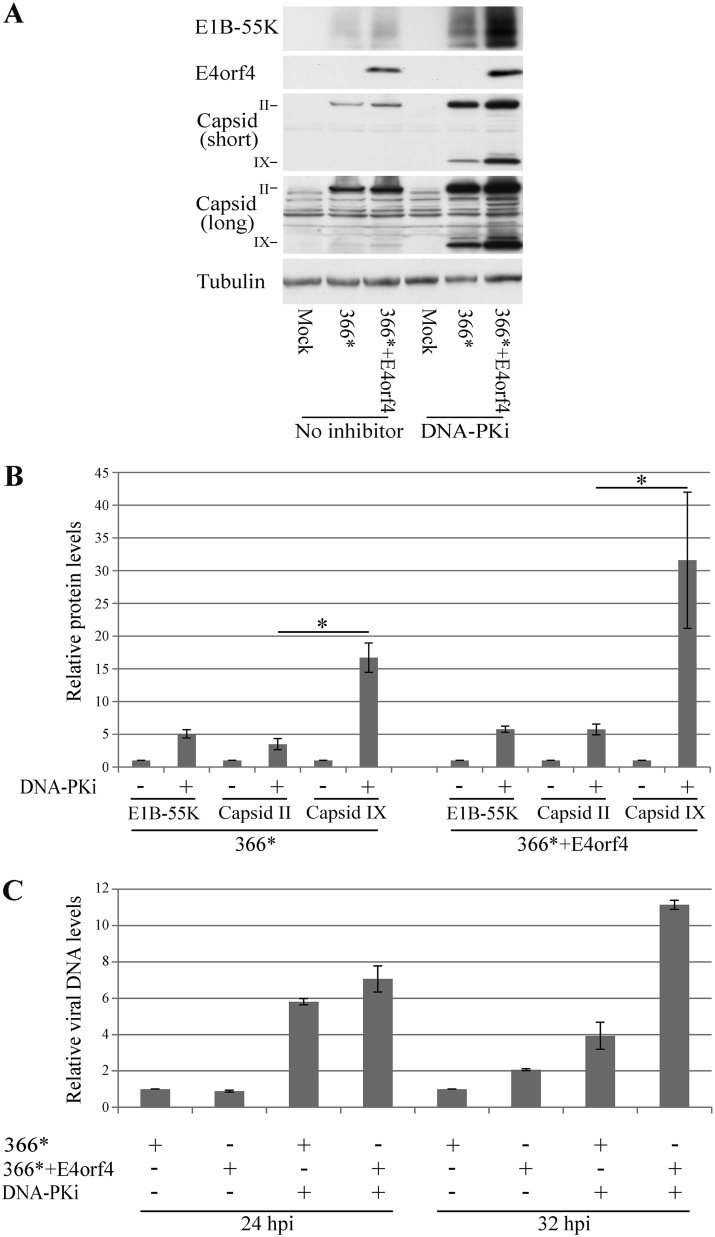
FIG 9.
Effect of DNA-PK inhibition on various stages of Ad replication. HeLa cells were infected with the Ad mutants dl366* and dl366*+E4orf4 or were mock infected. A DNA-PK inhibitor (DNA-PKi) was added to one set of cells at 2 h p.i. as described in Materials and Methods. (A) Proteins were harvested 24 h later, and Western blot analysis was carried out with the indicated antibodies. A representative blot is shown. Two different exposures of the blot stained with a capsid-specific antibody are shown (short and long). (B) Graph summarizing data from three independent experiments performed as described above for panel A. Protein bands were quantified by densitometry. Protein levels in cells infected without the addition of an inhibitor were defined as 1, and relative protein levels in the presence of the inhibitor are shown for E1B-55K, capsid protein II (hexon), and capsid protein IX (n = 3). Error bars represent the standard errors. Statistical significance was determined by Student’s t test. *, P < 0.04. (C) Virus DNA levels at 24 and 32 h p.i. were quantified by quantitative PCR and normalized to the level of cellular DNA represented by the PRPH2 gene. Viral DNA levels in untreated dl366*-infected cells at each time point were defined as 1, and relative DNA levels in the other samples are shown in a graph. Two replicates were analyzed. Error bars represent standard errors.

