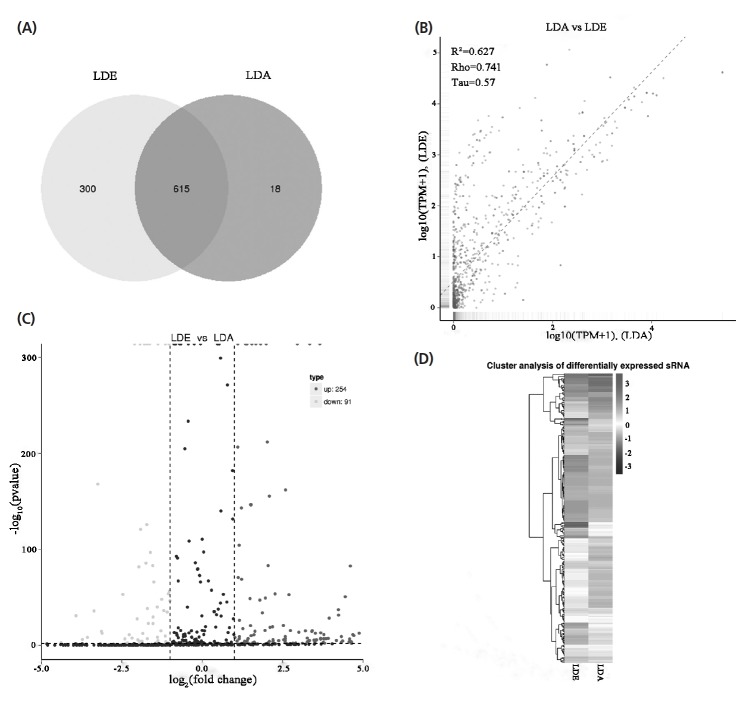
Figure 3.
The expression of miRNAs during skeletal muscle development. (A) Venn diagram of miRNAs discovered in LDA and LDE using Illumina sequencing. (B) The scatter plot shows the correlation of miRNAs between LDA and LDE via Illumina sequencing. The X and Y-axis are the log10 (TPM+1) of the LDA and LDE, respectively (R2, square of the correlation coefficient of pearson; Rho, the correlation coefficient of spearman; Tau, the correlation coefficient of kendall-tau). (C) Volcano plot of differential expression miRNAs via Illumina sequencing. The X-axis represents fold change of miRNA in LDA and LDE groups, and the Y-axis represents the expression changes of miRNA statistically significant degree. The scatter in the figure represents the miRNAs, the black dots indicate the miRNAs with no significant differences, the dark gray dots indicating a significant up-regulation of the miRNA, and the light gray dots represent a significant down-regulation of the miRNA. (D) Heat map of miRNAs in two development stages via Illumina sequencing. The miRNAs were clustered with log10 (TPM+1) values. Dark gray is high expression of miRNA, and black is low expression miRNA. LDE, longissimus dorsi_embryo (prenatal stage); LDA, longissimus dorsi_adult (postnatal stage).

