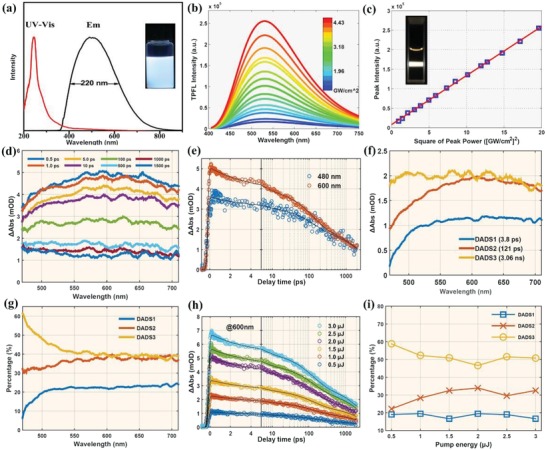
Figure 3.

a) UV–vis absorption, fluorescence excitation, and emission spectra (the inset photograph is under UV light). b) Two‐photon spectra with different laser excitation intensities from a 800 nm femtosecond pulse laser (the inset shows a photograph of a solution of Ti3C2 MQDs with the 800 nm laser passing through). c) Relationship between the two‐photon emission intensity and the square of laser excitation intensity has a linear slope of 1. d) TA spectra of Ti3C2 MQDs at indicated delay times from 0.5 ps to 1.5 ns. e) Kinetic decay traces at 480 and 600 nm. Black solid lines are fitted curves. f) Results of global fitting with five exponential decay functions showing five decay associated difference spectra (DADS). g) Percentage contributions of the three decay processes to the total dynamic within different wavelengths according to fitted DADS. h) Percentage contributions of the three decay processes to the total dynamic relating to surface state at different excitation energies. i) Percentage contributions of the three decay processes to the total dynamic relating to core state at different excitation energies.
