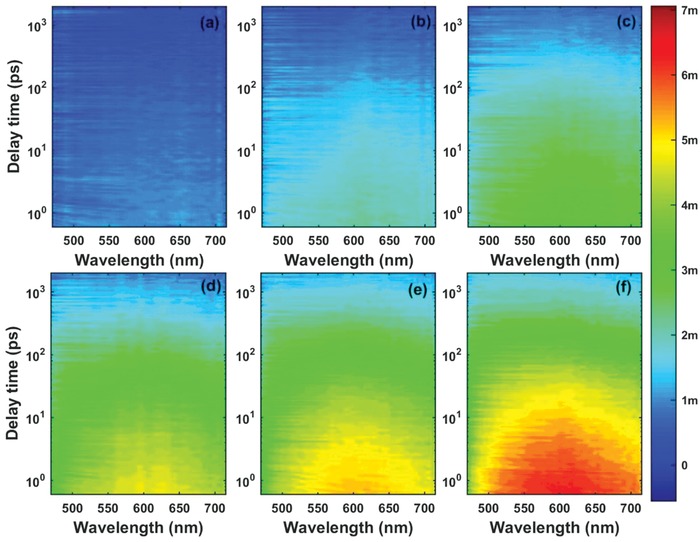
Figure 4.

2D pseudocolor maps of transient absorption (TA) spectra expressed in ΔOD as functions of both delay time and probe wavelength for the Ti3C2 MQDs with a pump wavelength of 400 nm at excitation energies of a) 0.5, b) 1.0, c) 1.5, d) 2.0, e) 2.5, and f) 3.0 µJ.
