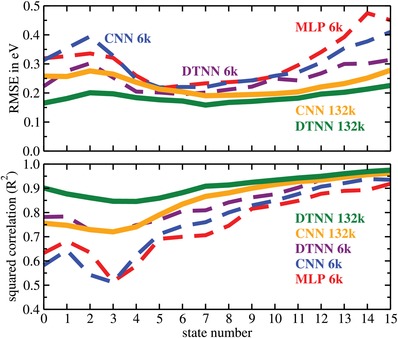
Figure 3.

Root mean square error (RMSE) and squared correlation (R 2) for the sixteen molecular excitations for the different neural network architectures and data sets. The states are labeled in descending order from the highest occupied molecular orbital (state number 0).
