Figure 1.

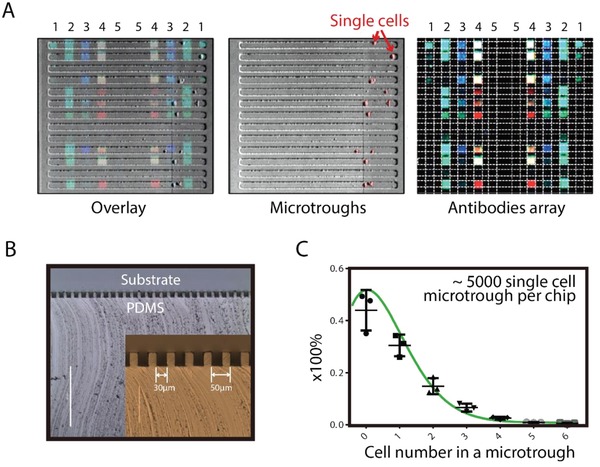
Single‐cell secretomic analysis microchip with higher throughput. A) Images showing the captured single cells, corresponding three‐color fluorescence detection results (red: 635 nm, green: 532 nm, and blue: 488 nm) and their overlay. B) Cross‐sectional view of microtroughs. Inset: enlarged view of the microtrough cross‐sections. The width of each microtrough is 30 µm. C) Distribution of the number of cells per microtrough under optimized cell loading conditions (cell density: 0.2 million per mL, loading volume: 200 µL, loading time: 5 min), which reveals around 30% of microtroughs would be occupied by single cells.
