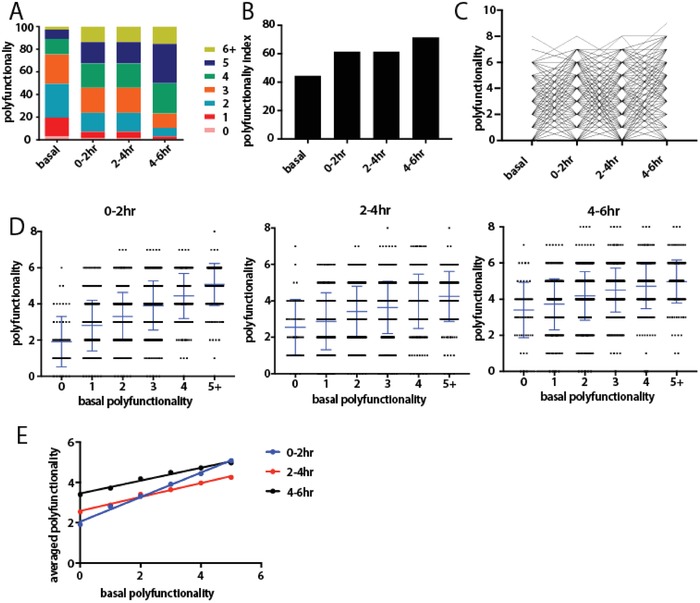
Figure 4.

Polyfunctionality analysis of human macrophages. A) Distribution of polyfunctionality among macrophages of each time window (basal state included). B) Gradual increase of polyfunctionality index (PI) along the immune activation process. C) Tracking polyfunctionality of each individual macrophage over time. D) Distribution of polyfunctionality of activated macrophages of each condition compared with basal polyfunctionality. The numbers of single cells with different polyfunctionality (0, 1, 2, 3, 4, >5) are 94, 360, 548, 427, 228, and 95, respectively. The p Value by t test between neighbors were <0.05 if not stated otherwise (ns: no significant). E) Linear correlation between later averaged polyfunctionality and the basal polyfunctionality.
