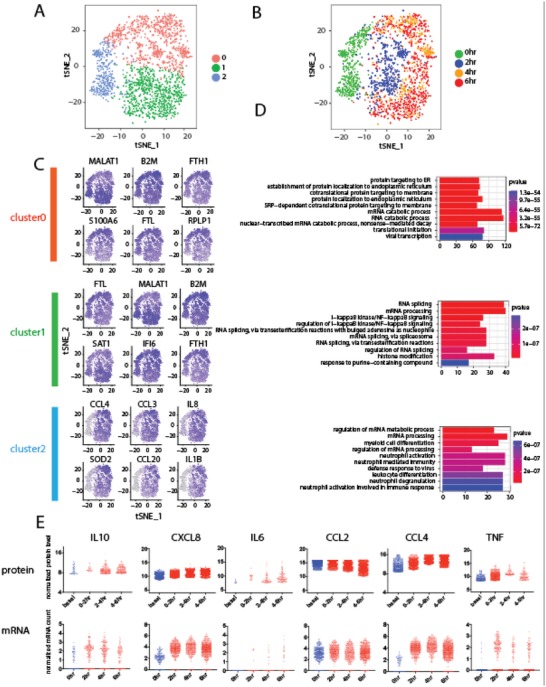
Figure 5.

Single‐cell RNA Seq of U937‐derived macrophages during dynamic TLR4 immune activation. A,B) tSNE plots showing dynamic formation of two cellular substates in activated macrophages. Cluster 2 overlaps with resting macrophages while clusters 0 and 1 are distinct substates of activated macrophages. C) tSNE feature plots showing expression of marker genes of each cellular substate. D) Gene Ontology term enrichment analysis reveals differential expression of immune activation and ribosomal genes in two substates among activated human macrophages. E) Comparative analysis of single‐cell mRNA and protein secretion data.
