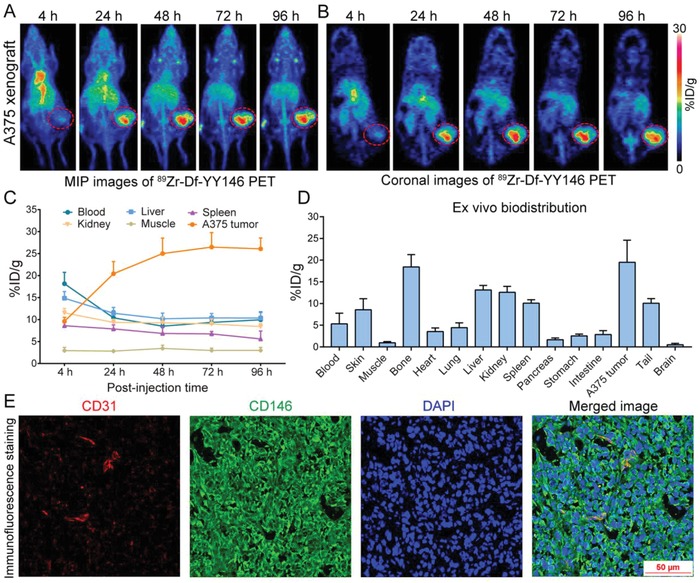
Figure 2.

89Zr‐Df−YY146 PET imaging enabled clear visualization of CD146‐expressing A375 xenografts. A,B) Representative maximum intensity projection (MIP) images and coronal PET images at varying intervals post‐injection of 89Zr‐Df−YY146. The position of the tumor is indicated by a red dashed circle. C) Time‐activity curves showing the uptake of 89Zr‐Df−YY146 in the tumors and other major organs at different imaging time‐points. D) Ex vivo biodistribution data obtained at 96 h following injection of 89Zr‐Df−YY146. E) CD31/CD146/DAPI triple‐staining of the resected A375 tumor. Immunofluorescence staining results showed intense expression of CD146 on the surface of A375 cells accompanied by co‐expression of CD31 and CD146 on the endothelial cells. %ID g−1 = percent of injected dose per gram of tissue.
