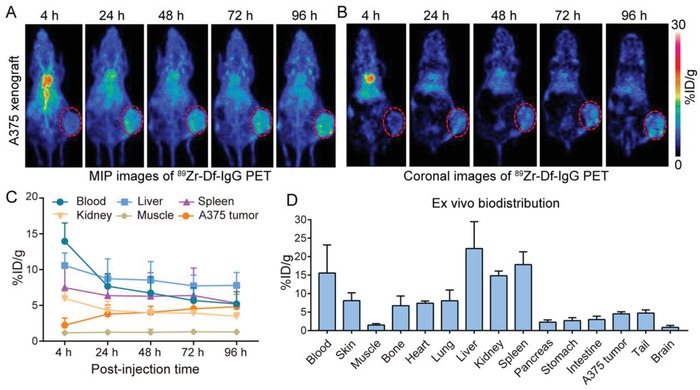
Figure 3.

Serial 89Zr‐Df−IgG PET imaging of A375‐bearing nude mice. A,B) Representative maximum intensity projection (MIP) images and coronal images at varying intervals post‐injection of 89Zr‐Df−IgG. The tumor is indicated by a red dashed circle. C) Time‐activity curves showing uptake of 89Zr‐Df−IgG in the major organs and also in the tumors. D) Ex vivo biodistribution data obtained at 96 h following injection of 89Zr‐Df−IgG. %ID g−1 = percent of injected dose per gram of tissue.
