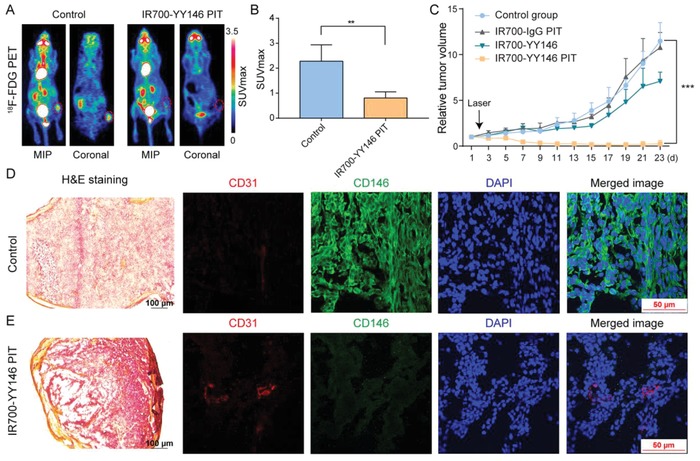
Figure 7.

IR700‐YY146 PIT of small melanomas. A) 18F‐FDG PET imaging was performed 5 d after IR700‐YY146 PIT to compare glucose metabolism between the tumors in the control group and in the IR700‐YY146 PIT group. A representative tumor in the IR700‐YY146 PIT group did not show any 18F‐FDG uptake above background level (right panel). B) Quantitative analysis of tumor 18F‐FDG uptake in terms of SUVmax demonstrated statistical significance between the control group and the IR700‐YY146 PIT group. C) Tumor growth curves of A375 xenografts receiving different interventions. D) H&E and immunofluorescence staining of A375 tumors treated with saline. While H&E image showed high tumor cellularity, immunofluorescence images revealed substantial expression of CD146 in A375 cells. E) H&E and immunofluorescence staining of A375 tumors following IR700‐YY146 PIT. H&E image in this group otherwise showed extensive necrosis with scant cellularity, accompanied by reduced expression of CD146 in A375 cells revealed on immunofluorescent images. (**p < 0.01, ***p < 0.001, n = 4 for each group).
