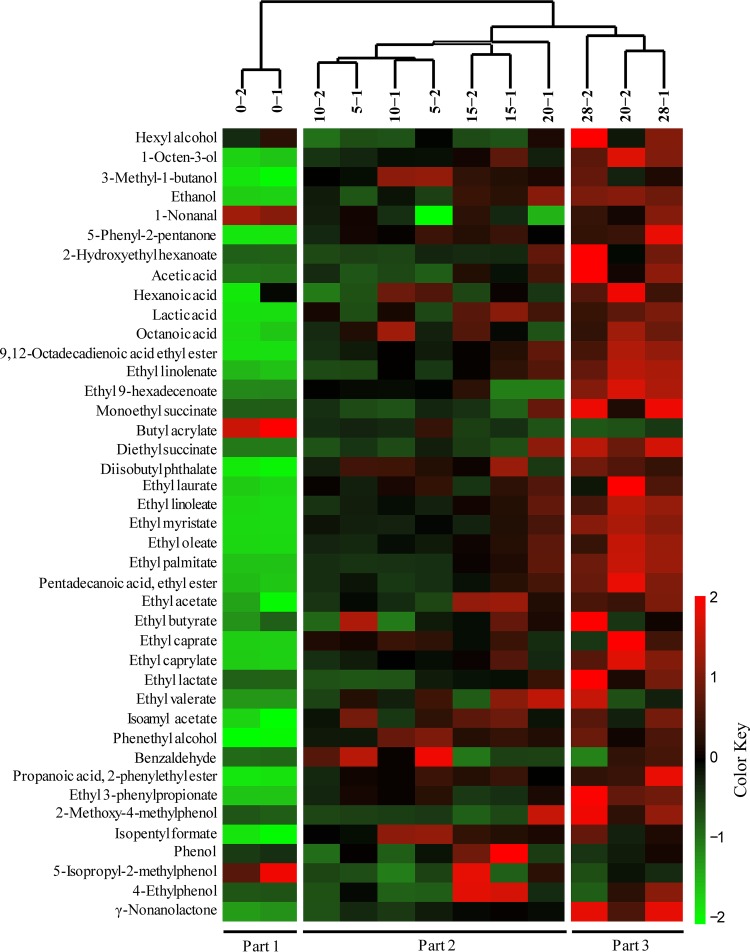
FIG 2.
Heatmap of flavor metabolites and hierarchical clustering in the in situ fermentation process. Flavor compounds were transformed by z-score. Clustering analysis was performed using the Pearson correlation coefficient and Euclidean distance based on the flavor contents during the fermentation process.

