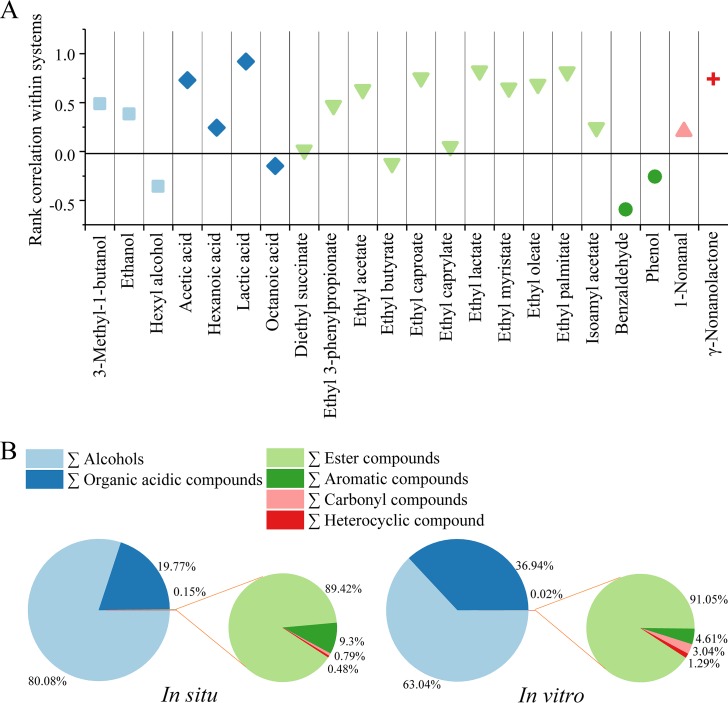
FIG 6.
Reproducible flavor metabolism in synthetic core microbiota. (A) Similarity of the two systems in 22 kinds of alcohols, acids, and esters. The y axis represents the Spearman correlation coefficient (ρ) of the flavor generation along the time axis in the two systems. The x axis represents the flavors in two systems. (B) Proportions of six kinds of flavor compounds in the in situ and in vitro systems.

