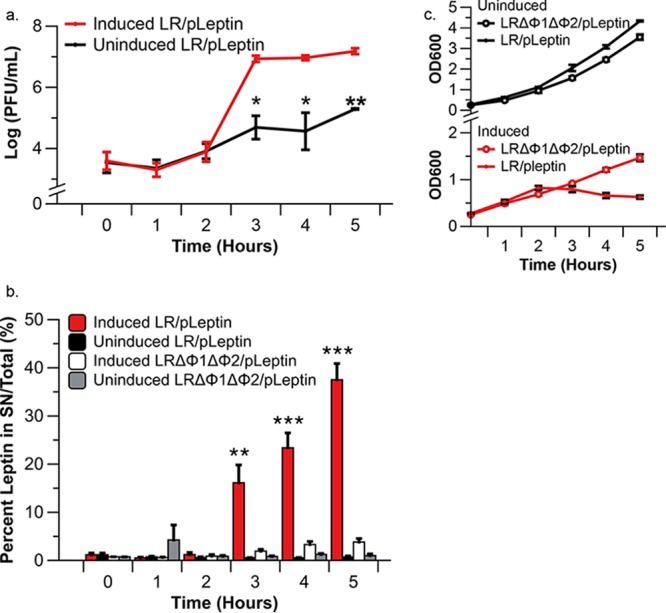
FIG 3.

Leptin release from recombinant VPL1014 following mitomycin C treatment. (a) Numbers of PFU derived from leptin-producing VPL1014 culture. No PFU were produced by induced or uninduced LRΔΦ1ΔΦ2/pLeptin. The results shown are averages from three independent experiments ± standard error. (b) ELISA data showing the percentage of total leptin (from the supernatant [SN] plus the cell lysate) released into the extracellular milieu. The results shown are averages from three independent experiments ± standard error. (c) Growth curves of uninduced LR/pLeptin, uninduced LRΔΦ1ΔΦ2/pLeptin, induced LR/pLeptin, and induced LRΔΦ1ΔΦ2/pLeptin are shown. Asterisks indicate statistical differences between respective induced and uninduced groups. *, P < 0.05; **, P < 0.01; ***, P < 0.001 (Tukey’s HSD). The results shown are averages of three independent experiments ± standard error.
