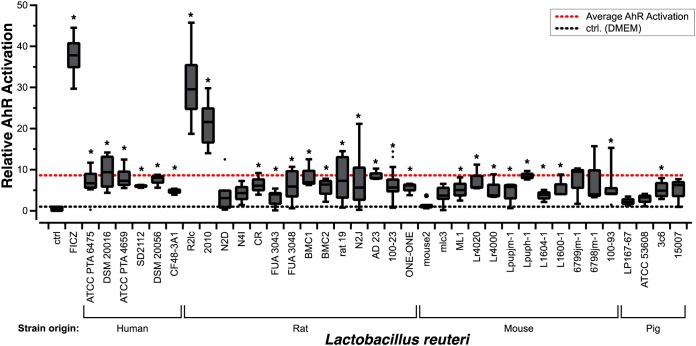
FIG 1.
Assessment of Lactobacillus reuteri AhR activation potential. L. reuteri AhR activation is strain specific. Data are represented as fold changes relative to the DMEM control (ctrl). The positive control is DMEM supplemented with 500 nM the AhR ligand 6-formylindolo[3,2-b]carbazole (FICZ). Data are presented as box-and-whisker plots. The whiskers represent the maximum and minimal values, and the lower, middle, and upper lines of the box represent first quartile, median, and third quartile, respectively. Open circles represent suspected outliers, which are data points that are 1.5 times below the first quartile or 1.5 times above the third quartile. Closed circles represent outliers, which are 3 times the value of the first or third quartile. Data represent averages of results from 3 independent experiments. Statistical significance between strains and the DMEM control was determined by the one-sample t test. Asterisks show statistical significance (P < 0.05).

