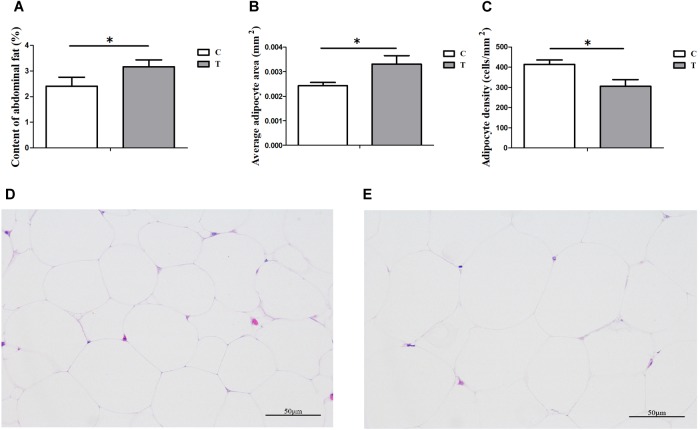
FIGURE 1.
Influences of heat stress (HS) on abdominal fat deposition in duck (n = 5 for each group). C and T stand for control and thermal treatment, respectively. The abdominal fat content (A), average adipocyte area (B), and cell density (C) were calculated, and the statistical differences between C and T were analyzed (∗P < 0.05). The adipose tissue sections (400×) of C (D) and T (E) were also presented here.

