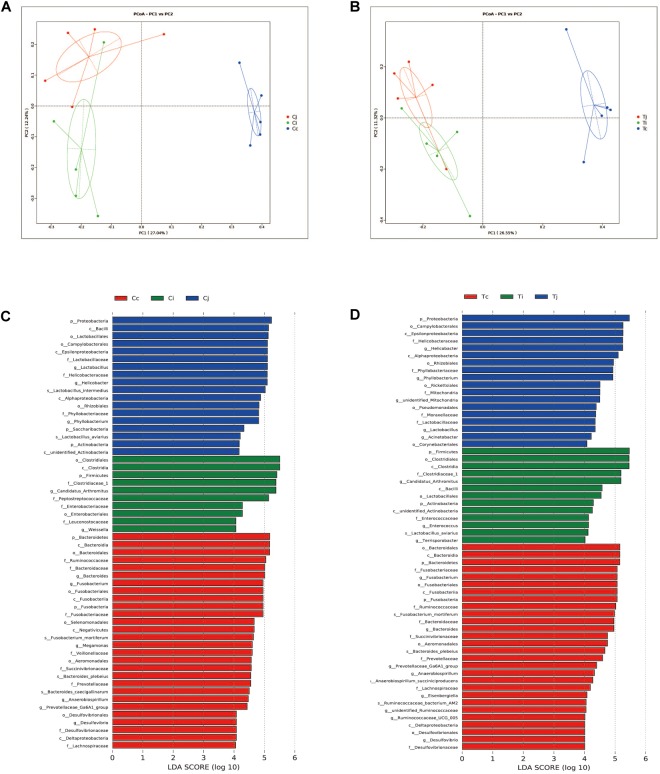
FIGURE 6.
Differential analysis of microbiota community among the 3 intestinal segments within group C and T. The principal coordinate analysis (PCoA) based on Binary-Jaccard distance was applied to observe the separation of the samples from C (A) and T (B). The Linear discrimination analysis (LDA) coupled with effect size (LEfSe) was used to identify the most differentially abundant taxa among the 3 intestinal segments within group C (C) and T (D). Only the results meeting an LDA significant threshold of >4 were shown.

