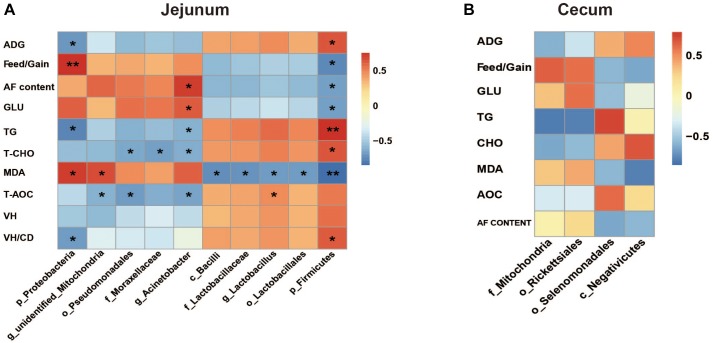
FIGURE 8.
The Spearman correlation analysis between the differential microbial species and measured parameters in jejunum (A) and cecum (B). ADG, average daily gain; AF, abdominal fat; Glu, glucose; TG, triglyceride; T-CHO, total cholesterol; MDA, malondialdehyde; T-AOC, total antioxidant; VH, villus height; CD, crypt depth. The red represents positive correlation and the blue represents negative correlation, respectively (∗P < 0.05, ∗∗P < 0.01).

