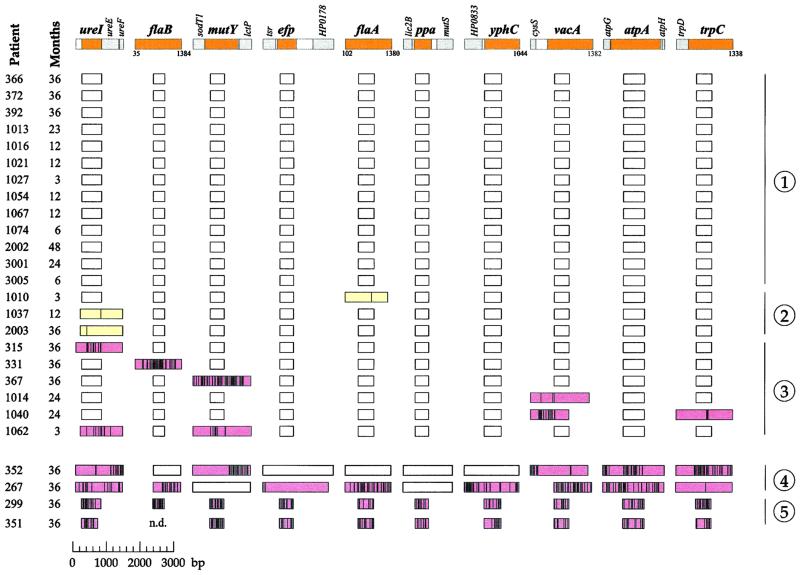
Figure 1.
Sequence comparisons of ten gene fragments from 26 pairs of isolates of H. pylori. The ten loci are indicated by tiny maps at the top of the figure (colors: core fragments, tan; flanking genes, gray; noncoding regions, white). The sources of the isolates are indicated by patient codes at the left (Colombia, three digits; Louisiana, four digits). The boxes indicate the lengths of the sequenced fragments, distinguished by color (white, identical sequences; yellow, SNPs; pink, clustered polymorphisms). Vertical lines within the boxes indicate the positions of sequence polymorphisms. The patients are separated into five groups (right) on the basis of all genetic changes between the paired isolates (1, no polymorphisms; 2, only SNPs; 3, clustered polymorphisms; 4, related isolates with numerous polymorphic fragments; 5, unrelated isolates). Mathematical analysis was only performed with data from patients in groups 1–3.

