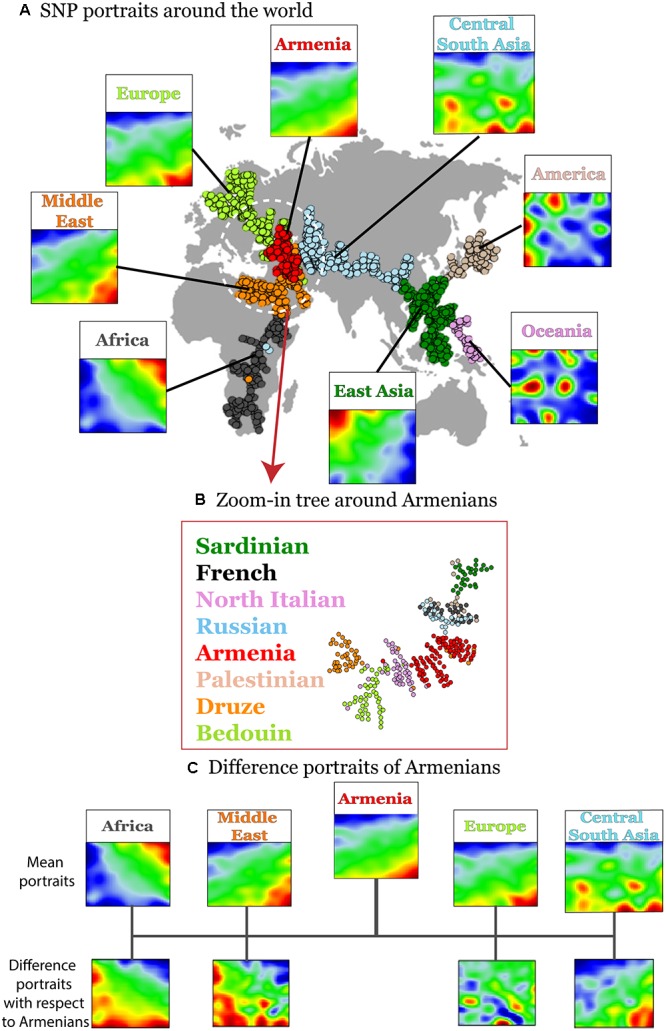
FIGURE 2.

Variation of disease-associated SNP portraits across geographic regions. (A) Mean SNP-portraits of seven geographic regions show systematic changes of their spot patterns. A minimum spanning tree (MST) was calculated using Pearson’s correlation coefficient between the SOM portraits of the individuals to visualize the similarity relations between their SNP-patterns. It is mapped on the geographic map to illustrate the relation between the genetic drift and the geographic distribution of the populations. Each circle refers to one individual. Their colors assign the respective geographic region. Armenians (red) form a cluster at the crossroad between African, European, and Asian branches of the MST. (B) A zoom-in SOM was calculated using data of selected populations from Middle East, Europe and Armenians for SOM-training to better resolve local similarity relations. The zoom-in MST reveals a relative compact clusters of Armenians bordered by populations from Middle East and Europe, respectively. (C) Difference portraits of Armenians with respect to other populations show an increase of non-African genetic contributions with respect to Middle Eastern populations and increased European contributions with respect to Central and South Asian populations.
